Monitoring how visitors are using your accessibility tools gives you a better picture of who’s using your site and what their needs are.
Activate data collection
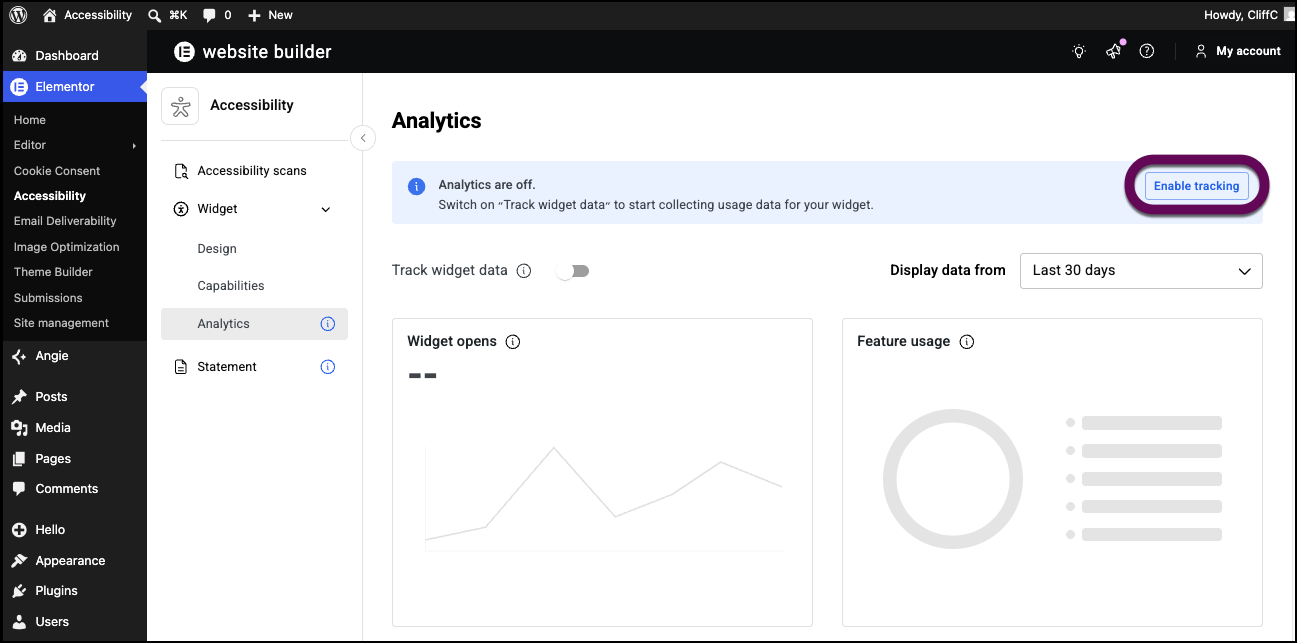
Data collection is turned off by default.
To activate data collection:
- Go to WP Admin and navigate to Elementor>Accessibility.
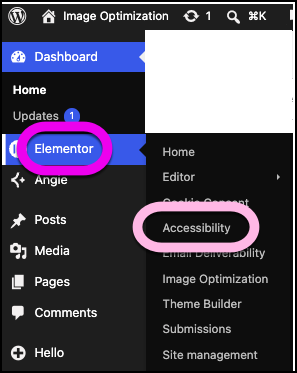
- In the left panel, click Analytics.
- Toggle Enable tracking on.
- Click Confirm & enable.
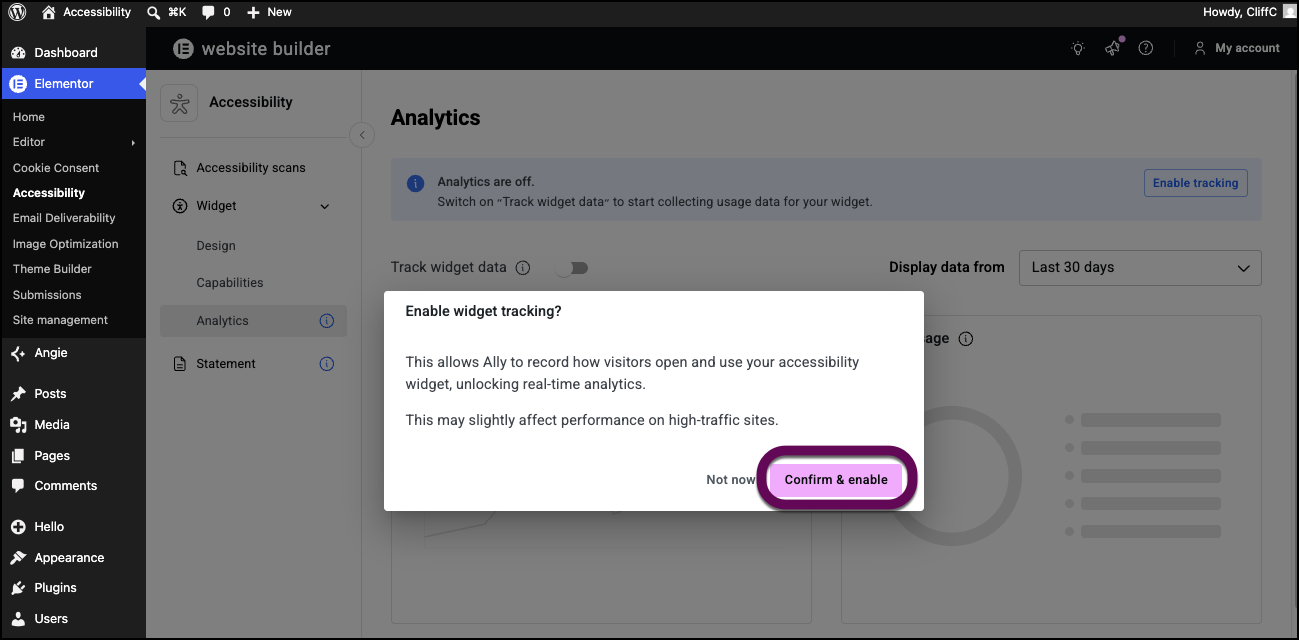
Web Accessibility will begin tracking how visitors use your accessibility features. Usage data is stored for 45 days. If you turn off usage tracking, Web Accessibility will stop tracking data, but previously collected data is stored for 45 days.
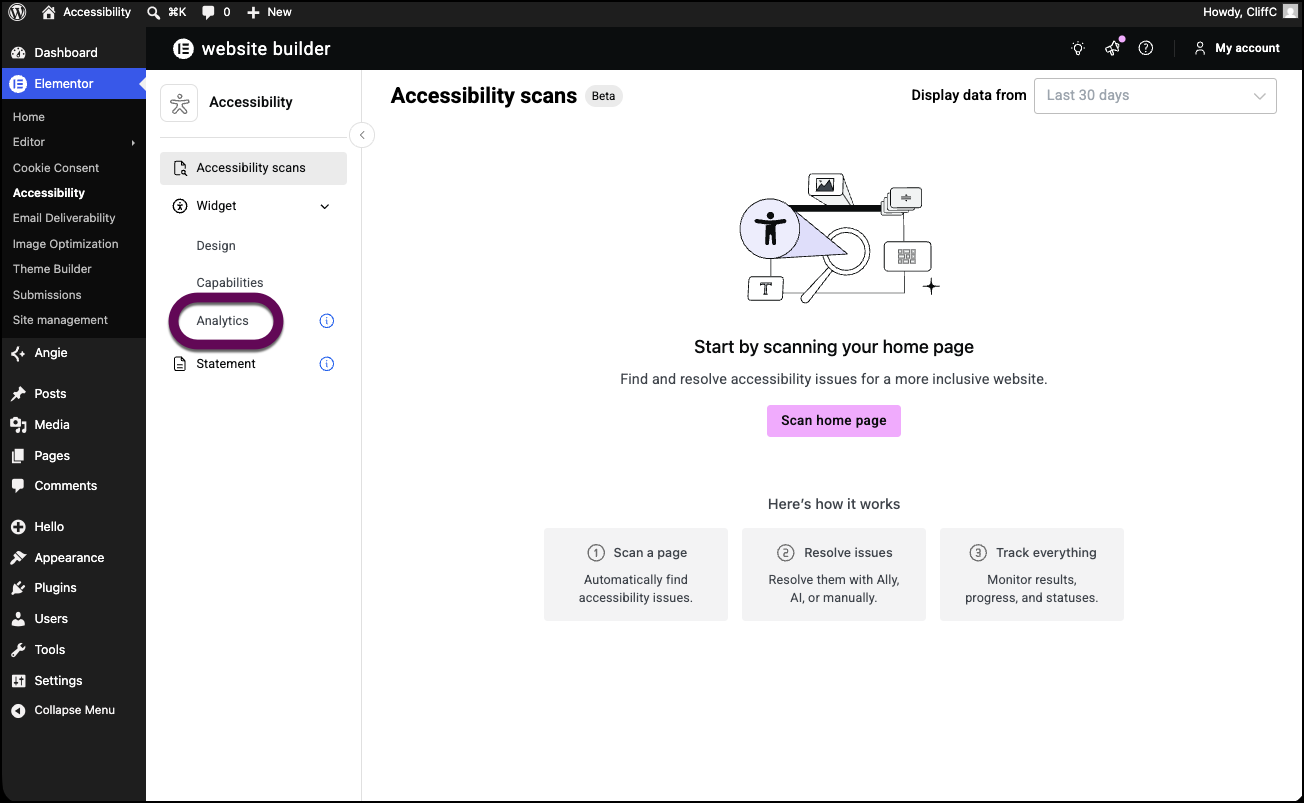
View your website analytics
After you begin collecting website statistics, you can view these statistics from your dashboard.
To view your website’s analytics:
- Go to WP Admin and navigate to Elementor>Accessibility.
- In the left panel, click Analytics.
Your website’s analytics appear in the right pane.
Date Range
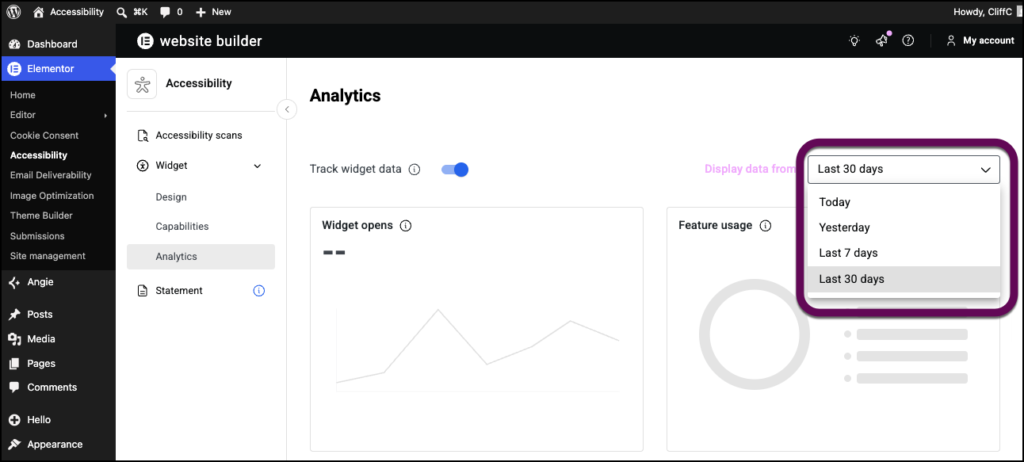
Use the dropdown menu to determine over what period of time the statistics will be displayed. Choices are:
- Today
- Yesterday
- Last 7 days
- Last 30 days
Widget activations
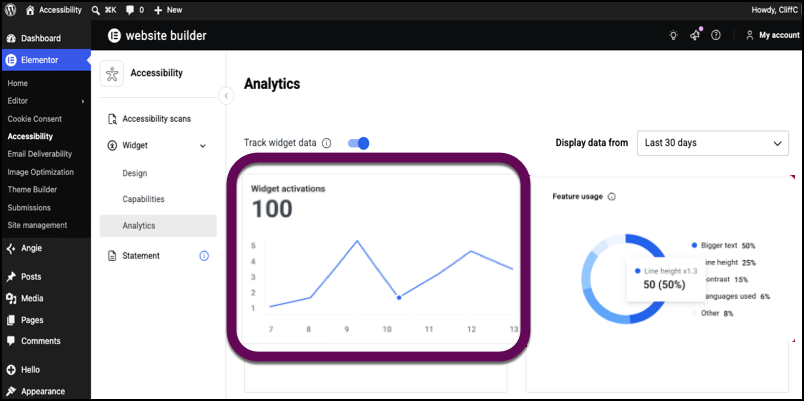
Widget activations displays the number of times the widget has been used by visitors during the selected date range. The statistics are displayed as a line chart so you can see trends in widget usage.
Feature Usage
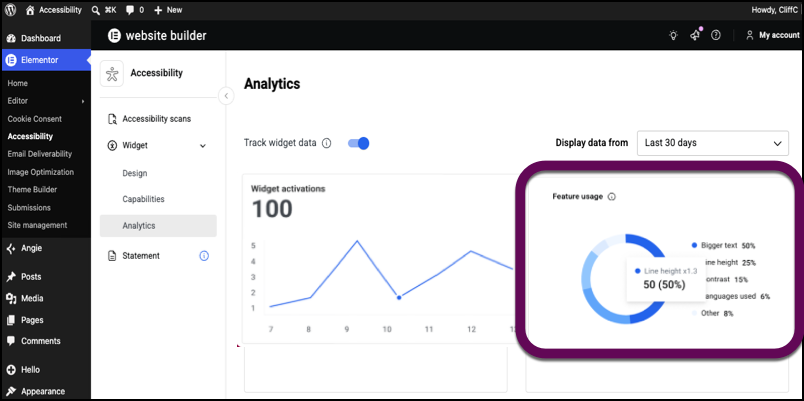
Features usage is a radial bar chart that displays the five most popular accessibility features your visitors have used and how often features were used relative to other features, within the selected date range. For instance, this chart displays how often Dark contrast is used relative to Light contrast.
Most used features
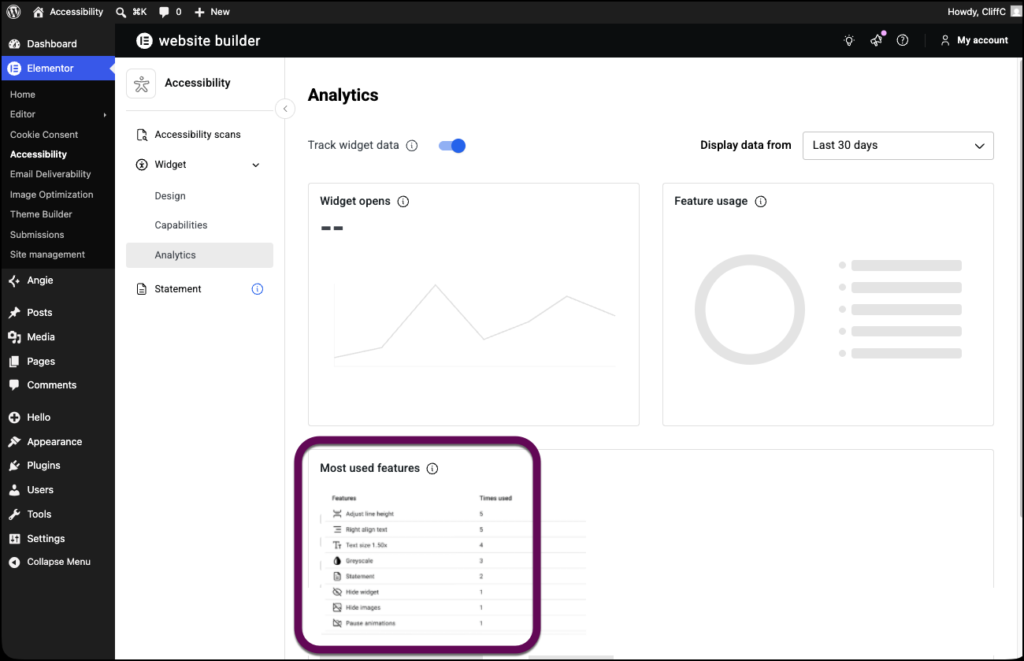
Most used features is a ranked list of the accessibility features your visitors are using along with the number of times they have been used in the selected date range.