Issue
You may need to check the browser console or use the inspector while troubleshooting website problems.
Solution
Each browser has its own method(s) of navigating to the Console. Following is the list of the most common ways for each of the main browsers:
| Browser | Action |
|---|---|
| Chrome | • For Windows – Press CTRL+SHIFT+J • For Mac – Press CMD+OPT+J |
| Firefox | • For Windows – CTRL+SHIFT+K • For Mac – CMD+OPT+K |
| IE/Edge | Press F12 |
| Safari | CMD-OPT-C Note: Works only if the Show Develop menu in menu bar check box in the Advanced tab of the Preferences menu is checked. |
| Opera | • For Windows – CTRL+SHIFT+I • For Mac – CMD+OPT+I Then click the Console tab |
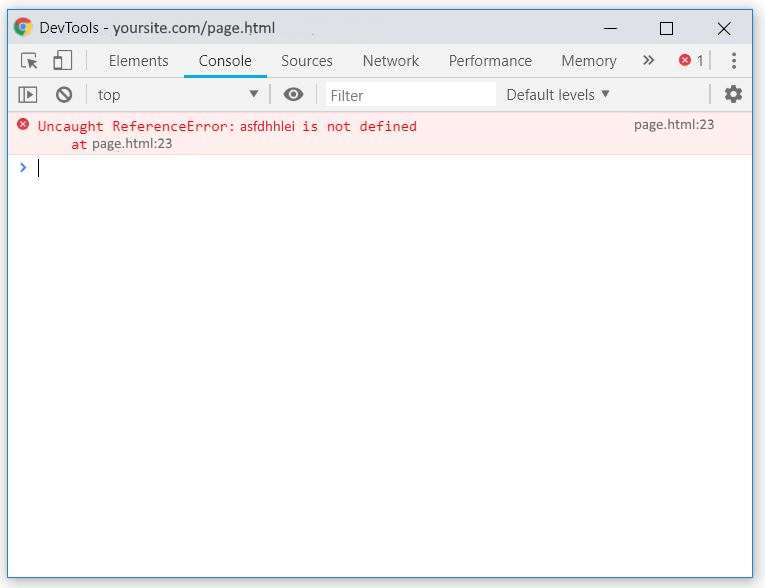
The Console shows errors in red with the location and line number where it occurred.
Related articles: