In today’s fast-paced world, slow websites are a problem. With the advancement of internet speeds, came the demand for fast loading websites.
A website’s speed has a big effect on your site’s user experience. In fact, it is perhaps the one thing that affects user experience the most. Users will become more frustrated and irked the longer a website loads and will simply abandon it if it takes too long to load.
Slow websites have higher bounce rates, lower conversion rates, and are just generally frustrating for your visitors to use.
If you want to understand where your site stands when it comes to site speed, you need to be able to accurately measure your site’s performance as it pertains to the real-world.
In this guide, we’ll show you how you can accurately configure a site speed test and interpret the results to gain meaningful insights into your WordPress site’s performance.
Table of Contents
Why Test Site Speed?
If you want to understand your visitors’ experiences when it comes to site speed, there are two types of monitoring:
- Real user data, based on how long it takes your site to load for each actual visitor – e.g. Pingdom Real User Monitoring.
- Synthetic speed tests, which is what most speed test tools run and what we’re focused on.
Synthetic speed tests are much easier to run and, as long as you properly configure your speed test, your results should be very accurate to the real-world load times that your visitors will experience.
What’s more, synthetic tests also let you gauge your site’s performance even as you’re building your website, which lets you flag potential issues before finalizing your site and launching it publicly.
For example, if you’re building a client website, synthetic speed tests help you optimize it before turning it over to the client.
Grow Your Sales
- Incredibly Fast Store
- Sales Optimization
- Enterprise-Grade Security
- 24/7 Expert Service
- Incredibly Fast Store
- Sales Optimization
- Enterprise-Grade Security
- 24/7 Expert Service
- Prompt your Code & Add Custom Code, HTML, or CSS with ease
- Generate or edit with AI for Tailored Images
- Use Copilot for predictive stylized container layouts

- Prompt your Code & Add Custom Code, HTML, or CSS with ease
- Generate or edit with AI for Tailored Images
- Use Copilot for predictive stylized container layouts
- Craft or Translate Content at Lightning Speed
Top-Performing Website
- Super-Fast Websites
- Enterprise-Grade Security
- Any Site, Every Business
- 24/7 Expert Service

Top-Performing Website
- Super-Fast Websites
- Enterprise-Grade Security
- Any Site, Every Business
- 24/7 Expert Service
- Drag & Drop Website Builder, No Code Required
- Over 100 Widgets, for Every Purpose
- Professional Design Features for Pixel Perfect Design
- Drag & Drop Website Builder, No Code Required
- Over 100 Widgets, for Every Purpose
- Professional Design Features for Pixel Perfect Design
- Marketing & eCommerce Features to Increase Conversion
- Ensure Reliable Email Delivery for Your Website
- Simple Setup, No SMTP Configuration Needed
- Centralized Email Insights for Better Tracking
- Ensure Reliable Email Delivery for Your Website
- Simple Setup, No SMTP Configuration Needed
- Centralized Email Insights for Better Tracking
- Ensure Reliable Email Delivery for Your Website
- Simple Setup, No SMTP Configuration Needed
- Centralized Email Insights for Better Tracking
How To Run a Website Speed Test
Again, synthetic tests are only valuable if you configure them in a way to get useful data. Here’s how to do that:
1. Pick the Right Speed Test Tool
Not all speed test tools are the same, so you’ll want to pick the option that best fits the type of test you want to run.
Different tools will give you different data/metrics and more/fewer configuration options – we’ll cover why those configuration options are important in the next few sections.
Here are some of the most popular and useful tools:
- GTmetrix – a flexible tool with a well-designed interface. Make sure to register for a free account to access the configuration options. However, the free version no longer allows testing for mobile devices.
- WebPageTest – the most configurable speed test tool. Great for testing different scenarios. However, the interface is a bit dated. You can use MachMetrics to run automated daily tests.
- Google PageSpeed Insights – includes synthetic test data from Lighthouse as well as real-world performance data from Google (though real-world data is only available if your site has enough traffic).
- Lighthouse – an open-source tool for analyzing web performance. Google PageSpeed Insights is based on Lighthouse, or you can also run Lighthouse from Chrome developer tools or web.dev.
- Pingdom Tools – the free tool lacks configuration options. However, the interface is well-designed. Also offers a paid Real User Monitoring service, as mentioned above.
- Uptrends – a well-designed tool that supports all the important configuration options.
- Fast or Slow – an excellent tool for assessing global load times from Wordfence. In one test, it runs tests from 18 different countries.
You don’t have to stick to a single tool – each option can be useful in certain situations. For example, WebPageTest is great for testing one location at a time because it’s so flexible, while Fast or Slow is useful for quickly gauging how your site’s load times vary across the globe.
2. Choose the Right Test Location
The physical location from which you run your speed test will affect your results. For this reason, you want to choose a test location that’s as close as possible to your target audience:
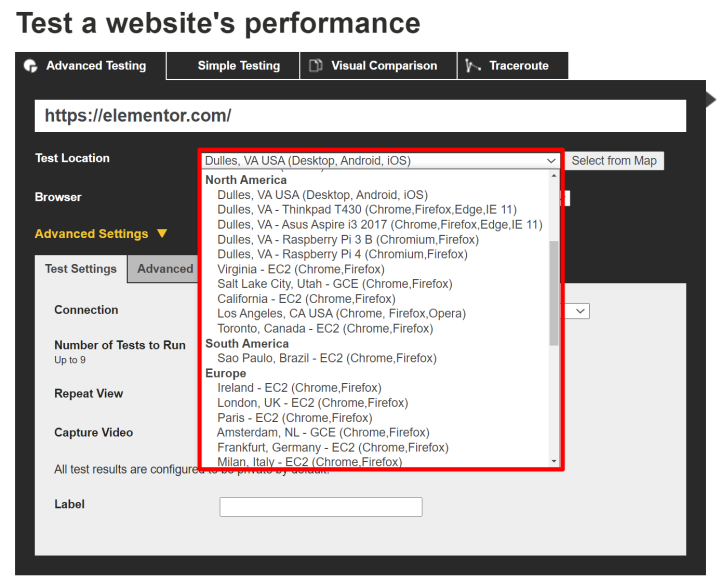
If you target visitors in multiple locations or all around the world, you’ll want to run multiple tests from different locations to get a better picture of your site’s global load times.
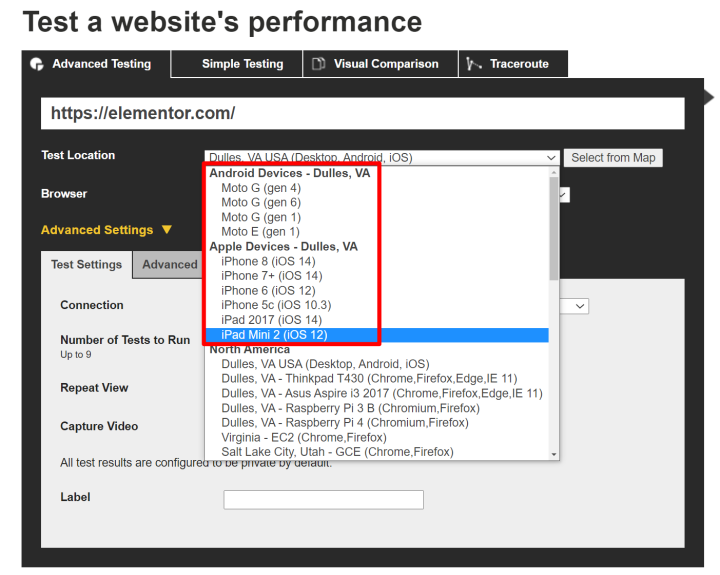
3. Run Tests for Different Devices and Browsers
The device that a visitor is using can have a big effect on performance.
For example, low-powered smartphones take longer to process JavaScript, which means that a JavaScript-heavy website will load much slower on those devices than it will on a high-powered desktop computer.
For that reason, you want to make sure that you’re at least testing multiple devices. You can also consider testing multiple web browsers to see if there are any differences between browsers:
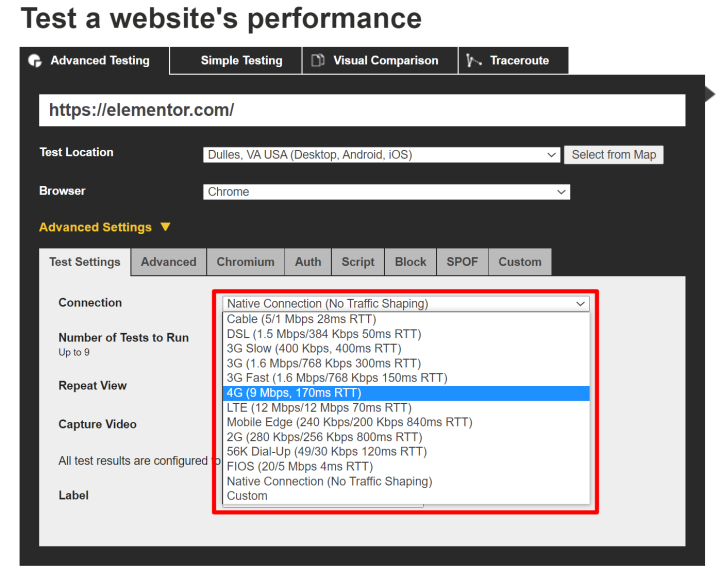
4. Pay Attention To Test Connection Speed
In the real world, not all of your visitors will have the same connection speed. Some might have high-speed Internet connections, while others might be browsing on a 3G or 4G network.
Some test tools, such as Pingdom, use an ultra-fast unthrottled connection for all tests. Other tools, such as WebPageTest and GTmetrix, let you choose a throttled connection that more closely mimics real-world situations.
For this reason, your site will often “appear” to load faster in Pingdom. However, if you want to accurately measure your real-world users’ experiences, you’ll want to use a throttled connection that mimics users’ actual speeds:
5. Run the Test Multiple Times
Finally, make sure you run multiple tests to avoid single-test variability, which can skew your results. In a one-off test, you can get outlier results that make your site seem slower or faster than it will for most of your visitors.
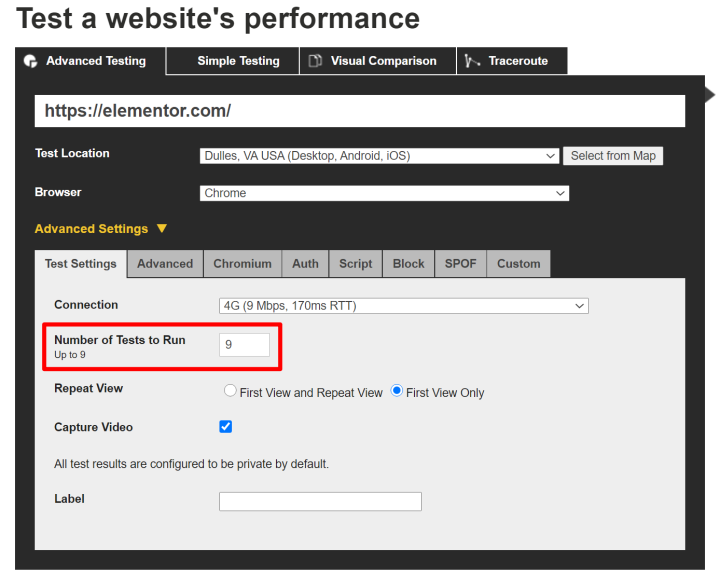
Some tools make it easy to run multiple tests. For example, you can configure WebPageTest to run up to nine separate tests at once and take the median value:
How To Understand Website Speed Test Results
Now, let’s get into how to understand the various metrics you’ll see in the speed test tools above.
Core Web Vitals (Largest Contentful Paint)
Core Web Vitals is a new initiative from Google that includes three metrics focused on capturing the user experience of your site.
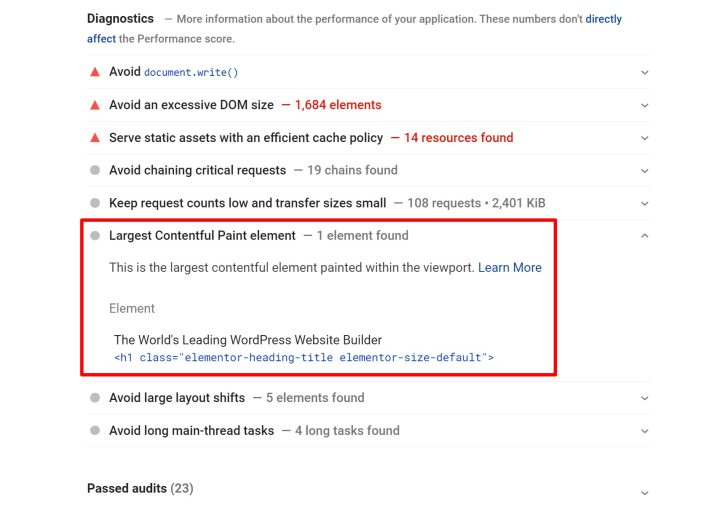
In terms of site speed, the most important metric is Largest Contentful Paint (LCP). LCP measures how long it takes for your site’s “main” content to load. If your site’s main content loads quickly, visitors will perceive your site to load quickly even if the rest of the content takes longer to load.
The “main” content will be different for each page but typically it’s the header text or image in your site’s hero section. For example, here’s the LCP element for the Elementor homepage for desktop visitors:

You can find your site’s “main” content by using PageSpeed Insights – make sure to test both mobile and desktop as the element might be different for each:
Google recommends that your LCP time is under 2.5 seconds.
To improve your LCP, you’ll want to speed up your Time to First Byte (another metric on this list), use caching, and implement other WordPress performance best practices. Inlining critical CSS and avoiding render-blocking JavaScript can also be especially useful for speeding up this metric.
Page Load Time
Page load time is a tricky metric to understand because there are multiple definitions of what page load means. To add even more confusion, different speed test tools use different page load definitions, which is one reason you might see slightly inconsistent data if you compare two different tools.
The key question here is “when is the page finished loading?”.
Here are the two most common definitions:
- Document Complete – the point at which all static content has loaded. In technical terms, when the onLoad event fires.
- Fully Loaded – the point at which all network activity has stopped for two seconds.
Your fully loaded time will almost always be higher because it accounts for additional behind-the-scenes scripts that might continue loading even after all of your static content has loaded.
Using an all-in-one performance plugin like WP Rocket can help you implement all the important best practices to improve your load times.
Time To First Byte
Time to First Byte (TTFB) is a general measure of server responsiveness – you also might see it called Server Response Time (SRT). It measures how long it takes to create a connection to the server and download the first byte of content.
Google recommends that your TTFB is under 200 ms
TTFB is heavily affected by backend performance. The two biggest culprits of a high TTFB are slow hosting and/or a slow DNS provider.
First Contentful Paint and First Meaningful Paint
First Contentful Paint (FCP) and First Meaningful Paint (FMP) share some similarities to the Largest Contentful Paint metric above.
First Contentful Paint measures how long it takes for the first text or image to be painted. The key difference between this and Largest Contentful Paint is that FCP doesn’t try to measure the “importance” of that content. Instead, it just looks for the first piece of “any” content.
First Meaningful Paint measures when the primary content of a page is visible to a user. However, because of some technical difficulties, Google has deprecated First Meaningful Paint in Lighthouse 6.0 and replaced it with Largest Contentful Paint. Despite that, you still might see FMP in some tools.
Google recommends that both your FCP and FMP times are under two seconds.
Optimizing your LCP will also improve these metrics.
Time To Interactive
Time to Interactive (TTI) measures how long it takes your site to become fully interactive for visitors.
For example, let’s say you added an accordion section using the Accordion widget. TTI measures how long it takes for your visitor to be able to click that accordion toggle and have your site respond by expanding the accordion section.
Google recommends that your TTI is under 3.8 seconds.
HTTP Requests
In order to load your page, a visitor’s browser needs to make an HTTP request to your site’s server (or third-party resources’ servers) for every single resource on your site:
- One image = one HTTP request
- One JavaScript script = one HTTP request
- One CSS stylesheet = one HTTP request
- Etc.
There’s no hard-and-fast rule for how many HTTP requests your site should have. However, in general, the fewer HTTP requests your site requires, the faster it will load.
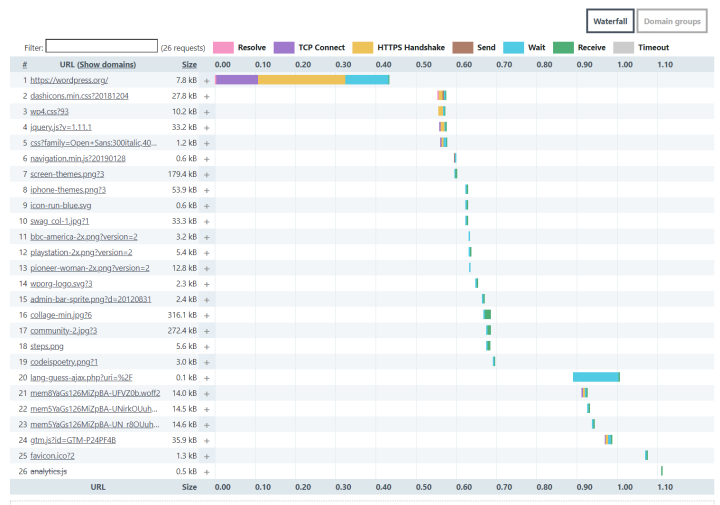
However, not all HTTP requests are equal – some are larger than others and/or take longer to load. You can view the sequence of how each HTTP request loads in a waterfall analysis, which most speed test tools offer. Here’s how it looks in Uptrends:
You can reduce HTTP requests by combining CSS/JavaScript files, limiting image usage, and using a script management plugin such as Asset CleanUp or Perfmatters. You should also limit plugin usage, as most plugins add their own HTTP requests. Elementor Pro can help you eliminate plugin usage by giving you access to many different features in a single plugin (e.g. forms, sliders, galleries, etc.).
Page Size
Page size refers to the overall size of your page. It’s the aggregate of the file sizes of all of a page’s code, images, scripts, etc.
In general, the smaller your site’s page size is, the faster it will load because visitors’ browsers need to download less data to load your site.
Some common tactics to reduce page size are compressing images, using server-level compression such as Gzip or Brotli, and minifying your code.
Test Your Website's Speed and Optimize It for Better User Experience
Understanding your site’s performance is essential to optimizing your website. Without data, you can’t know where your site stands and where it can improve.
However, if you want to collect meaningful data, it’s not quite as simple as just plugging in your site’s URL to a single speed test tool and calling it a day.
It’s important to pay attention to the specific configuration of your test – adjusting the location, device, and connection speed to get an accurate picture of how your site will perform for different types of users.
Once you have the data, you also need to understand the different metrics and what they mean. Fixing a slow Time to First Byte might require different tactics than improving your Largest Contentful Paint time, though there’s always some overlap in terms of performance best practices.
Do you still have any questions about how to test website speed on WordPress? Ask us in the comments!
Looking for fresh content?
By entering your email, you agree to receive Elementor emails, including marketing emails,
and agree to our Terms & Conditions and Privacy Policy.

