Table of Contents
There’s always room to improve your website. Site optimization is a constant process of adapting and making small changes in response to user reactions.
But how can you know what people are doing on your site? Unless someone goes out of their way to give you feedback, you’ll never know where you need to improve. If your site launch wasn’t as successful as you were hoping, there’s no way of telling what went wrong. What’s turning people away?
User tracking and analytics tools like Google Analytics solve this exact problem. These platforms offer detailed information about website traffic. This will give you that elusive intel on what users are up to on your site, and what elements might be causing them to leave.
If you want access to these invaluable statistics, we’ll show you how to install Google Analytics to WordPress using two different methods. It’s time to get the data you need to start making real improvements.
What is Google Analytics?
Google Analytics is a free online service that helps you track your website’s traffic. It’s currently the most popular analytics tool. This is for good reason. It’s free, easy to install, and gives you access to the info you’ll want the most.

The free plan comes with almost everything you’ll need, whether your business is small or large. No vital functionality is locked behind a paywall. But you can also try Analytics 360 to get access to advanced features like machine learning technology, advanced integrations, and better reporting.
The way it works is simple. You just insert a small Javascript tracking code onto your website, and anyone who visits executes the code. The information gets sent to your dashboard and instantly aggregated into visual data. It’s a very efficient system.
Here are examples of the data that Google Analytics collects.
- Who your users are – Demographics (gender, age range, interests, etc).
- What they do – Session duration, how many interactions they have with your website, and site search terms.
- Where they come from – the sites they’re visiting from, including social media
- Why they leave – the order of pages they visited, the first and last pages they saw, and bounce rate.
It goes without saying that this sort of data can give you a better picture of your users and what you can do to make their experience better.
Especially, because Google Analytics doesn’t just collect numbers. If you work best with visual figures, there are also graphs and charts, and simple-language interpretations. You don’t have to be a data analyst to use it, though there’s plenty of complex features, like conversion tracking, along with simple, easy-to-understand information, like session length.
Why Do You Need Analytics?
In the past, there was no way to tell what users did when they visited a website. The few tracking methods that existed were awkward and inefficient, and often the only data available was the fact that you got a visitor.
Nowadays, programs can track everything from what parts of the page people click on to even full session replays. The information available to you is so much more varied and useful.
With modern tools like Google Analytics, you can really get to know your audience. It’s even possible to anonymously track individual users across sessions, or to segment and target groups of people based on their demographics, locations, and interests.
Learning the particulars of how people browse your site and what’s causing them to leave it is data that can help you retain more users. Noticed a problematic bounce rate for a certain page? Found a certain page that seems to be causing people to leave more often? With Google Analytics, you can take steps to correct the issue.
Analytics trackers are also a great way to gauge how well your marketing efforts are doing. Is your latest promotion having an impact, or is traffic stagnating? Are people clicking through your CTAs and going to the right page?
But the best reason to use Google Analytics is simply that it’s free, and within a matter of a few minutes, you can start collecting data. Even if you won’t monitor graphs daily, you can set it up now and have plenty of data to work with if you need it later.
There’s no reason not to use it, and the benefits far outweigh the small cost of the short setup time.
GDPR Concerns
As you are probably aware, in 2018 the new General Data Protection Regulations (GDPR) of the European Union came into effect. This has wide-reaching consequences for the use of personal data on the web for anyone professionally within the EU.
Since using Google Analytics on your site means collecting a lot of data, doing it comes with a number of caveats. If you are subject to the GDPR, make sure to read up on what steps to take in order to comply with the new law. This post is a great place to start.
Initial Step: Sign Up to Google Analytics
Whatever method you choose for installing Google Analytics, you’ll need to have an account on the platform. While you can use any account you own, it’s best to create a separate business account for your website, if you haven’t already. You should keep your online blog/business and your personal account separated.
You can create a new Google account by going to the account creation page. Select Create account for my business (this turns on business personalization features) and finish the setup process.
With a Google account, you can sign up for Google Analytics. Click Start for Free to begin the process.
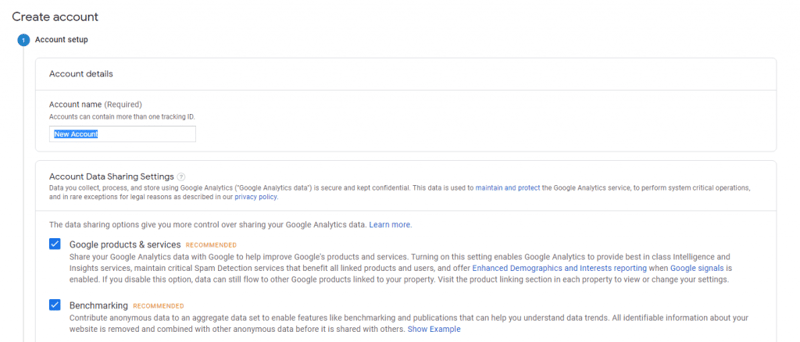
On the first page, enter your account name and choose what data you want to share with Google. Data sharing is optional but gives you access to extra insights and tools. And you may not be able to get accurate support if you untick Technical Support.
Next you can choose what you’re tracking: web, apps, or both. Since you’re using a WordPress website, you should select Web.
Finally, enter your website name, URL, industry, and time zone. With that, you’re signed up to Google Analytics! You won’t be collecting any data yet, but you can go ahead and familiarize yourself with the dashboard.
Using the Google Analytics Dashboard
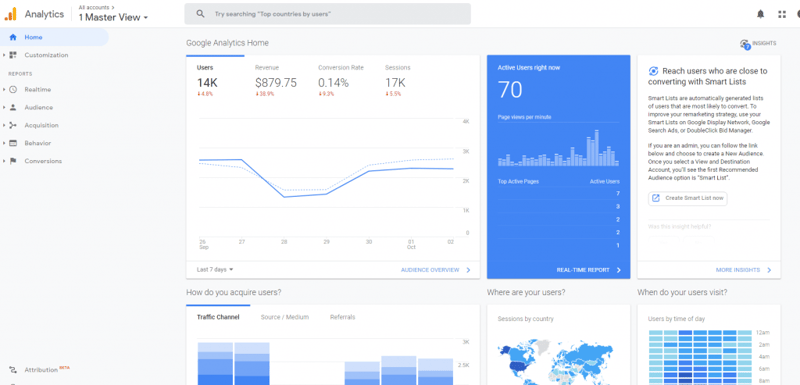
Though it’s as streamlined as this much data can be, the Google Analytics dashboard is a little complicated. You might be feeling overwhelmed just looking at it. Let’s break down each section and what they do.
Home
Starting from the left sidebar, the Home page contains all the most crucial statistics. Here you’ll find currently active users, country, time of day, device, popular pages, and more. There’s also the Insights/Ask Analytics Intelligence panel that directly answers common questions.
Customization
Next is Customization. This panel lets you create custom dashboards containing the statistics panels you want, or create a custom report that measures what you specify. These options let you make the dashboard your own.
Reports
Finally, there are the five Reports sections. These get into the nitty-gritty details.

- Realtime – This is your hub for real-time, constantly updating stats. This section is like a more in-depth homepage, offering an overview of your website’s activity.
- Audience – The Audience tab gives you detailed information on user demographics. This is the big one, where you’ll learn about user interests, demographics, engagement and returning behavior, cross-device visits – and a lot more.
- Acquisition – Acquisition is all about what platform people visit from. Are they coming from Google search, referral links, or advertisements?
- Behavior – In this tab, you’ll learn what pages people are visiting, what links they are clicking on, and how they “flow” through your website’s pages.
- Conversions – A conversion is a goal you want users to complete when they visit your site. It can range from downloading a file to visiting a certain page. You can configure unique conversions here, and get data when they’re completed.
You’ll also see settings under Admin at the bottom. This is where you can find your tracking code if you lose it.
There are a lot of advanced things you can do with Google Analytics. The help section can help you get the hang of things. However, now it’s finally time to add Google Analytics to WordPress.
Method 1: Manually Install Google Analytics to WordPress
Do you prefer to get things done using as few plugins as possible? If you want to keep your admin area clean, you should consider installing Google Analytics by hand. This means you won’t get the extra functionality, like having analytics data in your WordPress dashboard.
Note that you should only try this if you’re comfortable editing your site, and preferably have done it before. It may be better to install a plugin if you’re not used to editing WordPress files, or just want a faster solution.
The easiest manual method is to add the Google Analytics global site tag to header.php.
The very first thing you should do is back up WordPress. Don’t skip this step; messing with code can break your site and be extremely difficult to undo. If you make a mistake, the backup will restore everything back to normal. You can do it manually or using a plugin.
With a backup completed, open Google Analytics and go to Admin > Property > Tracking Info > Tracking Code. Leave this page open.
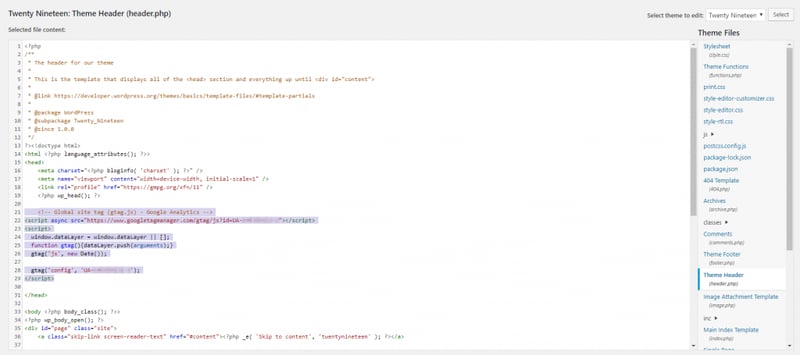
Log into your WordPress backend and go to Appearance > Editor. Then click Theme Header (header.php) on the sidebar. If you have switched off the internal editor for security reasons, you can also get to this file via FTP. It’s located in your currently active theme’s folder under wp-content > themes.
Back on the Google Analytics page, you’ll see a section called Global Site Tag (gtag.js). Copy the code and paste it right above the closing </head> tag, and click Update File.
It’s as simple as that. You should now be tracking every page on your site.
Note that whenever you make changes to your WordPress theme like that, it’s always best to do it in a child theme. That way, you don’t lose your modifications to a theme update.
If you have trouble editing the header file, you could also try downloading the Insert Headers and Footers plugin and simply pasting the header code in there. Just find it under Settings > Insert Headers and Footers.
(Speaking of headers and footers, check how to create beautiful specimens in Elementor here.)
If you’d rather avoid editing any code and try a plugin instead, we have a few suggestions.
Method 2: Use a Google Analytics Plugin
Installing a plugin is the quickest way to install Google Analytics in WordPress. Just a few clicks and you’re finished, no code or possible complications to deal with. In addition, these Google Analytics plugins come with other features you may find desirable.
Most addons can be installed using the WordPress plugin repository, which you can access from the main plugin page or through the Plugins tab on your admin dashboard. You can download plugins directly here by typing the name into the search bar, and clicking Install Now.
If you downloaded a file from the repository or a third-party site, just go to Plugins > Add New and click Upload Plugin at the top.
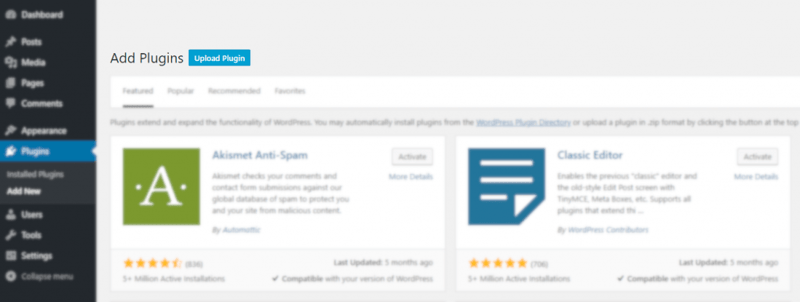
Whichever way you choose, after installation, you find your new plugins under Plugins > Installed Plugins. Here, you activate, deactivate, and remove them if necessary.
Now that you know how to install addons, here are three popular Google Analytics plugins, their key features, and how to set them up.
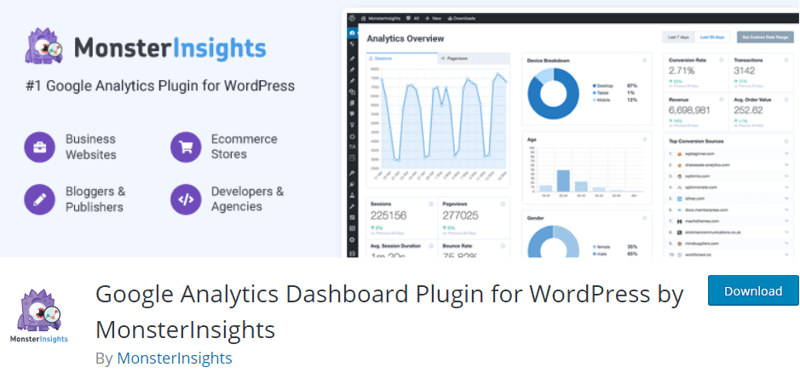
The most popular analytics plugin for WordPress, MonsterInsight’s option, makes statistics simple. It installs in just a few clicks and puts the graphs and charts right on your dashboard. Features like ecommerce and events tracking can be easily enabled without having to add extra code.
MonsterInsights cuts out the least useful stats and aggregates the rest into a custom report on your dashboard. If you often struggle through Google Analytics’ dashboard trying to find the info that really matters, this plugin will do the hard work for you.
Besides feature-rich integrations with WooCommerce and Easy Digital Downloads, there’s also a GDPR-compliance addon that provides tracking notices and opt-out links.
Once you’ve downloaded and activated the plugin, you’ll need to connect your Google Account. You’ll have a new tab called Insights on your backend. Go to Insights > Settings and click Connect MonsterInsights. Choose the account you used to set up Google Analytics and allow it access.
With that, everything should be working properly, and you can go to Insights > Dashboard to see the graphs. It can take 24 hours for the data to appear, but when it does, you’ll have a full suite of statistics.
There’s also a premium version of MonsterInsights that supports multiple sites, SEO tracking, more integrations, and a lot of other advanced features. This upgrade might be a good investment if you’re looking to get a little more out of your analytics plugin.
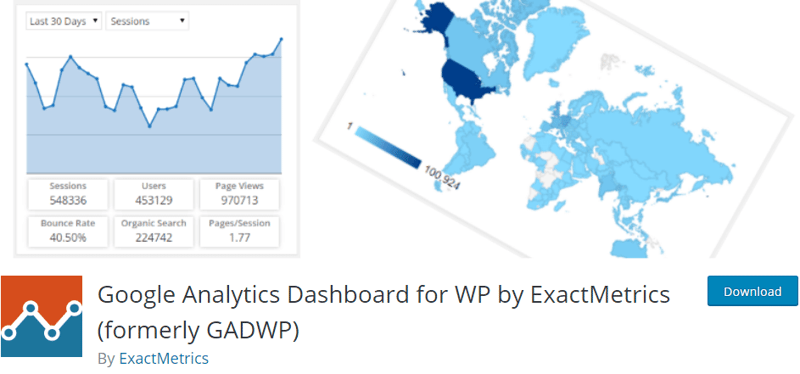
Unlike many freemium plugins, this one is instantly appealing as all its features are available for free.
ExactMetrics has several advantages:
– The plugin automatically Inserts a tracking code on every page
– It lets you access analytics on your dashboard, the All Posts and All Pages screens, and even on your frontend site.
– You won’t ever need to leave WordPress to see your stats.
With in-depth customization features, you can track downloads, link clicks, tags, hits by publication date, and other areas of user interaction. You can even use it on multisite, all for free.
Once ExactMetrics is installed and activated, on your admin dashboard, go to Google Analytics > General Settings and click Authorize Plugin. Then click Get Access Code.
On the next screen, authorize the account you used to set up Google Analytics. Copy the code you were given, paste it in, and click Save Access Code.
Everything should now be properly set up, and your tracking code automatically entered. On your back end, you can go to Google Analytics > Tracking Code to check.
You can see the new charts by going to the Dashboard page in your backend. They should be the first thing you see when you log in.
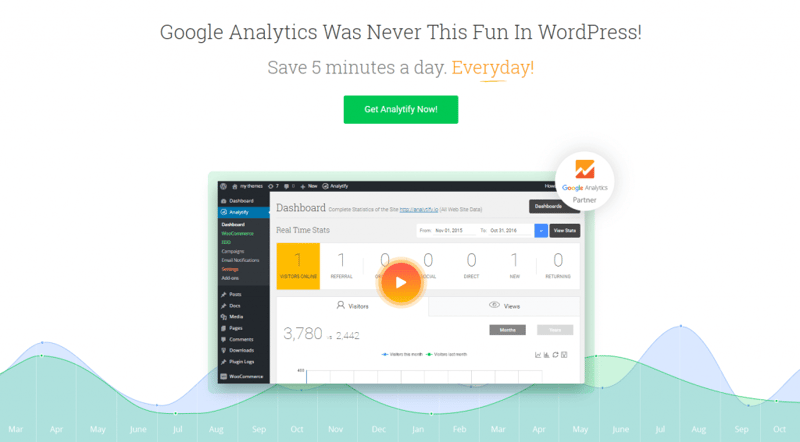
As already mentioned, one downside to Google Analytics is that it’s hard to navigate and understand. Many people have trouble getting used to it. Analytify is a premium WordPress plugin that aims to solve this issue, presenting Google Analytics stats with user-friendly charts.
Every complicated number is broken down and shown in a way anyone can understand. No more hunting through the maze of submenus in Google Analytics and struggling to understand what it’s trying to tell you.
Analytify integrates well with WordPress, showing custom stats for each page and post type. There are several addons available to further extend the platform, including WooCommerce and Campaigns plugins. Pricing starts at $39 and you can purchase a more expensive license if you need it for multiple sites.
To install it, you’ll first need to download the free core version (which you can also use on its own). The pro version requires you to install the free plugin, so you can’t skip this step.
Next purchase a license of Analytify. You’ll receive a downloadable file in an email, or you can get it from your Analytify account on the website. Go to Plugins and click Upload File, then activate it. Then you can link your Analytics account and start familiarizing yourself with the user-friendly statistics dashboard.
Google has created its own official WordPress plugin to make integrating with its tools a snap. That’s not just Analytics, but also Search Console, AdSense, and several other Google addons for webmasters.
Plus, this is a totally free and open source. No premium features locked behind a paywall, just simple integrations with Google products — you don’t even need to add tracking codes. And it works seamlessly with other plugins, so if you already have one that covers Search Console integration, you can still use Site Kit for all its other features.
Once you’ve installed and activated the plugin, navigate to the new Site Kit menu in your WordPress backend. The first thing you’ll need to do is connect your Google account and set up the Search Console.
Click Start Setup to get started and follow along with the instructions. If you don’t have a Search Console account yet, one will be made for you automatically.
Once this process is finished, you can go to Site Kit > Settings > Connect More Services and add Analytics. If you don’t have one yet, you’ll need to make a Google Analytics account first. Click Set Up Analytics and again follow the steps to verify your account and grant permission for Google to connect analytics to your website.
With those simple steps completed, Google Analytics should be automatically linked to your site, and its stats will show up on your dashboard.
Install Analytics to Start Gathering Data
Analytics are a necessary part of running a website. Without them, any changes you make in the name of improvement will simply be guesses to what your users actually want. With Google Analytics, you can cut out the guesswork and get actionable data about your visitors’ habits.
Whether you want to install Google Analytics manually or with a WordPress plugin, either method can be done in only a few steps and for free. There’s no reason not to try it. Once you have the tool working, you’ll begin collecting stats that you can use to optimize your website and improve user satisfaction.
What’s your analytics plugin of choice? Or do you prefer to set it up the manual way? Give your recommendation in the comments!
Looking for fresh content?
By entering your email, you agree to receive Elementor emails, including marketing emails,
and agree to our Terms & Conditions and Privacy Policy.