Table of Contents
What is it they say, “Those who cannot remember the past are doomed to repeat it”? While it’s valuable to look back at years past in web design, we shouldn’t look too far back.
Things change very quickly from year to year in web design as well as the state of the web as a whole. To look too far back is to reference trends, strategies, and tools that are useless to us today.
What we want to do instead is to focus our time machines on the previous year and gather up the most recent and relevant data points from there. That way, as we aim to figure out what’s going on in the digital space and how to further improve it as web designers, we’ll have an accurate picture to work with.
In the following roundup, that’s exactly what we’ve done. We scoured the web for the most recent reports, studies, and surveys from 2021 and compiled over 40 web design statistics that’ll help you in the year ahead.
Table of Contents
- 42 Latest and Greatest Web Design Statistics for 2022
- WordPress Statistics
- Website and Web Design Statistics
- Mobile Web Design Statistics
- Ecommerce and Conversion Rate Statistics
- Customer Loyalty Statistics
- Search Engine Optimization (SEO) Statistics
- Website Privacy & Security Statistics
- Website Speed Statistics
- Are You Ready for the Future of Web Design?
42 Latest and Greatest Web Design Statistics for 2022
As you’ll soon see, web designers that want to offer the best value and results to clients in 2022 will need to be more than just talented creatives. The following web design statistics will shed some light on where you need to focus your efforts going forward:
Web Design Statistics: Editor’s Choice
1. 59% of the world’s population is online. (DataReportal) That’s 4.66 billion people actively using the Internet to look up information, discover new solutions and conveniently buy what they need without having to step foot inside a business establishment.
2. 92.6% of Internet users use their mobile phones to go online. (DataReportal) With so many people visiting websites from smartphones, responsive design is a critical component of a company’s success today.
3. People spend an average of 6 hours and 54 minutes online each day. (DataReportal) In addition, 3 hours and 39 minutes of that time are spent on mobile. Despite spending so much time online, the choice as to where they spend their time isn’t a simple one.
4. There are more than 1.9 billion websites. (Internet Live Stats) With nearly 2 billion websites, Internet users have become increasingly dependent on search engines as well as other platforms like social media to help them find the best of the best. But it’s not just a tech platform’s thumbs-up they’re looking for. They’ll ultimately decide for themselves which websites are worth visiting based on their quality.
5. 73% of consumers trust the information on a business’s website over other sources. (BrightLocal) While people will go in search of customer reviews on Google and social proof on platforms like Facebook or TikTok, they don’t put as much stock in these sources as they do on a brand’s website. So, it’s incredibly important that web designers create websites and keep them updated, so they can give visitors something worth trusting.
WordPress Statistics
6. 43.25% of all websites are built with WordPress. (W3Techs) When a content management system is used, WordPress accounts for 65.2% of all websites. Regardless of how you look at it, WordPress is the most popular solution for building and managing websites in 2022.
7. 36.28% of the top 1 million websites are built with WordPress. (BuiltWith) Over a third of the world’s leading companies have chosen WordPress as the platform to build their websites with. But it’s not just enterprises that entrust their online businesses to this content management system. According to BrightLocal, it’s the most commonly used CMS by local businesses, too.
8. WooCommerce is the most commonly used WordPress plugin and Elementor is the second. (W3Techs) The WordPress repository has tens of thousands of plugins available for use. However, there are certain plugins that WordPress users tend to gravitate towards. 20.4% of WordPress websites have WooCommerce installed, making it the most commonly used plugin. Elementor isn’t too far behind with 15.9% of users using it to design their web pages.

Website and Web Design Statistics
9. The average cost of a website built with core features in 2022 is $3200. (GoodFirms) For the average business website, web designers actually charge a wide range of pricing:
- 35.1% of designers charge between $1000 and $1500
- 24.3% charge between $2000 and $2500
- 16.21% charge $3000
- 10.81% charge $4000
- 13.51% charge between $5000 and $6000
10. The average turnaround time for a professional website in 2022 is 2 months. (GoodFirms) Considering the majority of web designers who responded to this survey use professional design software like Photoshop, this estimate seems realistic. However, there may be more efficient ways to build a professional-grade website. It all depends on your process, toolkit, as well as the complexity of the client’s request.
11. 88.5% of web designers believe that the top reason visitors leave a website is that it loads too slowly. (GoodFirms) Other reasons they gave for website abandonment were:
- Non-responsive web design (73.1%)
- Badly designed navigation (61.5%)
- Outdated design (38.5%)
- Poorly structured content (34.6%)
12. 42% of consumers say they’ll leave a website that poorly functions. (Top Design Firms) It appears that web designers know their users well as all the reasons they gave in the GoodFirms survey for website abandonment do contribute to a poor user experience.
13. 50% of consumers believe that brands should prioritize web design. (Top Design Firms) Survey respondents indicated that website design is critical to a brand’s success. The elements they tend to focus on most are:
- Photos and images (40%)
Colors (39%) - Page layout (38%)
- Navigational links (38%)
- Videos (21%)
- Fonts (18%)
14. Consumers prefer to see the colors blue and green in web design. (Top Design Firms) Blue is a color commonly associated with confidence and stability. Green is commonly associated with growth and nature. It’s no surprise that these positive colors tend to resonate well with consumers.
15. 80% of marketers use websites in their marketing strategies. (HubSpot) The website is the second most useful marketing platform behind social media. When you look at the metrics marketers use to measure their success, you can see why:
- Sales (62%)
- Web traffic (53%)
- Lead generation (40%)
- On-site engagement(40%)
- SEO success (32%)
It’s clear what a pivotal role a website plays in marketing if the majority of the key performance metrics are dependent on how well the site performs.
16. 23% of small retailers don’t have a website in 2022. (Digital) It’s surprising that so many businesses in the retail space haven’t made the move to a digital home yet, especially in light of what happened during the pandemic. According to the report, a wide range of reasons was given:
- 33% prefer to use social media instead
- 32% don’t believe they need a website
- 29% say that most of their customers aren’t online
- 26% think they don’t have enough staff to run one
- 26% don’t think they have enough money to build one
- 24% don’t know how to create or run one on their own
- 21% say a website is a waste of time
Web designers should arm themselves with this data so they can proactively address these concerns as well as misunderstandings with prospective clients.

Mobile Web Design Statistics
17. 85% of Americans own a smartphone. (Pew Research) The number is much higher in younger consumers, with 96% of 18- to 29-year-olds and 95% of 30- to 49-year-olds owning a smartphone.
The 65+ age range continues to be slow to adopt smartphones with only 61% owning one.
While it’ll be important to prioritize responsive design this year, designers will need to be mindful not to focus solely on the mobile experience.
18. Consumers in the U.S. check their phones every 5.5 minutes when they’re awake, on average. (Reviews.org) That’s no exaggeration either:
50 minutes is the average time they spend on their phone before bed
62% sleep with their phone beside them
80% check their phone within 10 minutes of waking up.
With so many self-proclaimed smartphone addicts, web designers should factor in ethical design strategies when building websites going forward.
19. 88% of the time people spend on smartphones is within mobile apps. (eMarketer) eMarketer found that Americans spend an average of 4 hours and 5 minutes on their phones each day. 3 hours and 41 minutes takes place in mobile apps while 24 minutes is on websites.
For some companies, it won’t make sense to build an app. However, web designers should start thinking about how to imbue websites with app-like qualities in order to provide a more desirable mobile experience in the browser.
20. 54.8% of global website traffic occurred on mobile devices in Q1 of 2021. (Statista) With mobile continuing its dominance over website traffic, web designers will have to make responsive design a priority if they haven’t already. What’s more, they should pay close attention to individual website analytics to ensure their sites align with this global trend. Websites that fall short may require mobile tune-ups so they can keep up with the pack.
21. 31% of all retail commerce sales in the U.S. come from mobile customers. (Statista) That comes out to about $338 billion USD in sales. As mobile web visits grow, we can expect to see their share of sales grow, too.

Ecommerce and Conversion Rate Statistics
22. 6,000,000 people are shopping online every minute. (Statista) Web designers specializing in the ecommerce space will have their work cut out for them. To stay in front of customers, they’ll have to keep online stores updated in response to shopping trends, holidays, consumer demand, and more.
23. Experts predict that ecommerce companies around the world will generate $5.4 trillion in revenue in 2022. (Statista) With steady year-over-year growth in e-retail sales, now is the time to get involved in ecommerce if you haven’t already. That goes for web designers as much as it does entrepreneurs.
24. 46% of consumers prefer to shop in person as opposed to online. (Raydiant) Despite the growth of ecommerce, many shoppers still prefer the in-person experience to the digital one. 33% say it’s because they want to see and feel products, while 26% simply enjoy the experience.
25. 59% of customers do online research before shopping. (Raydiant) Even though many customers prefer to go to the store, the web still plays an important role in their shopping experience.
This is just one reason why websites need to be equipped with features to help shoppers research and compare products. Even if they won’t complete their purchase online, the site will give them the information and tools they need to make a more confident decision at the store.
26. 65% of shoppers who have a good in-store experience are more likely to interact with the retailer online. (Raydiant) The good news is that positive in-store experiences often lead customers to connect with retailers online (and through their websites). As a result, web designers will likely spend more time on omnichannel customer experience features (like buy-online-pick-up-in-store) in 2022.
27. 69.25% of ecommerce sessions took place on mobile in Q3 of 2021. (Kibo Commerce) Just a little over a quarter (27.75%) of global ecommerce shopping activity came from desktop users. Unfortunately, we still don’t see this favorability of mobile when it comes to purchases.
2.1% of mobile shoppers users converted as opposed to 3.85% of desktop shoppers. There’s a similar disparity in the average order value (AOV) as well, with mobile shoppers spending an average of $118.65 compared to $162.88 spent by desktop shoppers.
For web designers, this could mean that the shopping experience needs to be improved on mobile. Or it might mean focusing mainly on equipping mobile sites with shopping features related to the parts of the sales funnel that take place there (like research and product comparison).
28. 87% of customers want a personalized shopping experience. (Kibo Commerce) It’s not just personalized product recommendations that make their experience better either. 31% of retailers said that adding personalized search to their sites drove up their ROI by at least 200%.
29. 49% of shoppers blame high extra costs for abandoning their carts at checkout. (Baymard) Surprising shoppers with additional costs related to taxes, shipping fees, and the like is never good business. But that’s not the only reason why shoppers have given up on a purchase when they reach the last step:
24% left when a site asked them to create an account
18% wouldn’t go through a checkout that was too long or complicated
17% didn’t trust the site with their credit card information
12% said the site crashed or they experienced an error
Just as poor performance is the primary reason people abandon websites, poor checkout design and functionality will do the same for your conversion rate.

Customer Loyalty Statistics
30. 80% of brands believe they provide a superior customer experience while only 8% of customers agree. (Accenture) That is a huge gap in perception. While web designers aren’t responsible for designing customer service policies within companies, they can help improve how customer service is handled through the features on the website (like live chat or contact forms).
31. 68% of consumers say it’s more difficult for brands to hold onto their loyalty than ever before. (Clarus Commerce) There are a number of reasons why consumers have become more finicky. As a designer, you’ll have to pay close attention to this as the more loyal customers a brand has, the more money they stand to make. Learn what makes users tick so you can design a site that boosts their loyalty, not loses it.
32. 48% of shoppers have replaced products they typically buy from physical stores with online alternatives. (Raydiant) When designing a website for a company entering a space dominated by physical retailers, keep this web design statistic in mind. With waning loyalty — even for long-standing brand favorites — new businesses have an opportunity to swoop in and claim that loyalty if they offer the right product, in the right place, and at the right price (among other factors).

Search Engine Optimization (SEO) Statistics
33. There are 5,700,000 Google searches done every minute. (Statista) That might seem like a lot of searches, but there’s a lot of competition out there (1.9 billion competitors, to be exact). In order to build a site that “beats” Google’s algorithm and gets to the coveted first search engine results page (SERP), web designers need to become masters of SEO.
34. Google owns 86.64% of the search engine market share. (Statista)
Google is the primary search engine used around the world. To build a website that ranks in a meaningful way, designers will have to play by Google’s rulebook.
35. 36.7% of SEO professionals believe that Core Web Vitals is going to become the most important component of an SEO strategy. (Search Engine Journal)
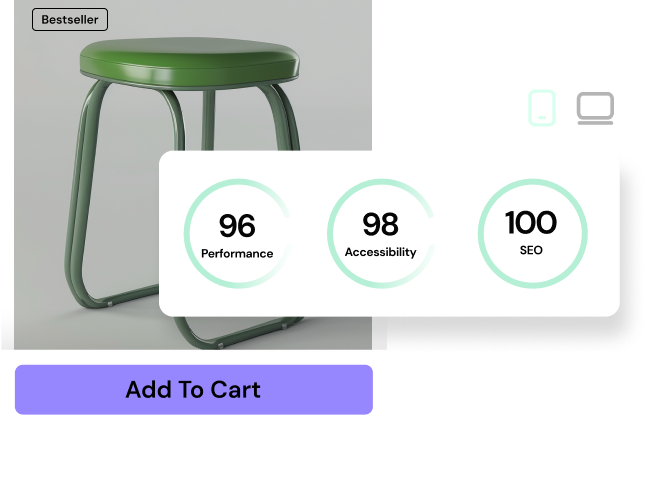
Core Web Vitals is one of the most recent updates to Google’s search algorithm. It evaluates and scores a website based on four key areas: SEO, performance (speed), accessibility, and best (design) practices. A web designer that can master these technical SEO strategies can enable their websites to win big in search results.

Website Privacy & Security Statistics
36. There were over 86 billion password attacks on WordPress websites in the first half of 2021. (WPScan/Wordfence) WordPress websites tend to be a major target for hackers simply because WordPress is the most popular CMS and its vulnerabilities are well-known. Like weak passwords and login procedures.
Wordfence reported a huge increase in attacks in 2021. Not only did the firewall plugin detect 86 billion password attack requests, but it blocked 8,227,887,615 brute force attempts in January alone.
37. 33.1% of Internet users are concerned about their personal data getting misused. (DataReportal) It’s not just WordPress users who face danger on the web. Over a third of Internet users worry about how their personal data may be exploited. A website can address these concerns through the use of recognizable partner integrations (like PayPal for payments) and security trustmarks.
38. 42.7% of people use ad blockers. (DataReportal) There’s a mix of reasons why so many people enable ad blockers in their browsers these days:
- There are too many ads (22.3%)
- Too many ads are annoying or irrelevant (22.3%)
- They’re intrusive (19.9%)
- Ads take up too much space (16.7%)
- Ads slow down page loading times (14.6%)
- They might compromise their privacy (11.2%)
For the most part, it seems that consumers are most concerned about the poor experience that ads cause online. Knowing this, designers should explore alternative avenues to monetize websites.

Website Speed Statistics
39. 85% of web pages load slower than 5 seconds. (Unbounce) While Google may recommend that web pages need to load within five seconds or less, research has shown that it’s more like a three-second threshold. With so many sluggish landing pages on the web, a website that’s optimized for performance could become a major standout in its space in 2022.
40. If a page takes more than 3 seconds to load, nearly 50% of users will refresh the page. (Unbounce) Part of the reason for this is that people are more likely to believe it’s a slow Internet connection keeping a site from loading than the site itself. However, if the refresh doesn’t fix things, 22% will close the tab and 14% will head over to a competitor’s website.
41. 70% of consumers say that slow loading speeds make them less willing to buy from a company. (Unbounce) Customers already have a number of grievances when it comes to ecommerce checkout. With the vast majority of them indicating that slow loading speeds are a problem, designers will need to prioritize performance if they want to maximize their store’s sales.
42. Over 50% of consumers would prefer you use fewer media if it means faster loading times for them. (Unbounce) When asked what they’d be okay with sacrificing if it meant a website would load faster, consumers reported the following:
- 56.6% would do away with animations
- 52.8% would be okay with giving up video
- 24.1% would remove photos
While some visitors might be okay with fewer photos, it appears that they’re more valuable to them than animations and video. This is important to remember when choosing which media to put in your design.
Are You Ready for the Future of Web Design?
The web is changing at a fast pace and, with it, the consumers we’re trying to sell to. By equipping yourself with the latest and greatest web design statistics, you’ll get a better sense of what’s going on in the digital world and how you can design websites that will succeed there.
Looking for fresh content?
By entering your email, you agree to receive Elementor emails, including marketing emails,
and agree to our Terms & Conditions and Privacy Policy.