Table of Contents
It’s called “Inspect Element,” and it’s a powerful developer tool built directly into every modern web browser, including Chrome, Firefox, Safari, and Edge. As a web creation professional, I use it every single day. It’s my x-ray vision for the internet. It lets me see the hidden structure (HTML) and style (CSS) of any webpage. This guide will show you how to use it, from simple text changes to advanced debugging.
What Is ‘Inspect Element’ and Why Should You Use It?
At its core, Inspect Element (or “Developer Tools”) is a built-in feature that lets you see and temporarily edit the code of a live website from within your browser. Think of a website as a finished, painted house. You can see the outside, but you cannot see the ‘2×4’ studs, the electrical wiring, or the plumbing. Inspect Element is like a special pair of goggles that lets you see all of that hidden framework.
It opens up a panel, usually at the bottom or side of your screen, that shows you two key things:
- The HTML (HyperText Markup Language): This is the “skeleton” of the page. It’s the raw content and structure, like the headings, paragraphs, and images.
- The CSS (Cascading Style Sheets): This is the “skin” or “paint.” It’s the styling that defines all the colors, fonts, sizes, and layouts.
Key Use Cases for Inspect Element
You might be thinking, “Why would I want to see a bunch of code?” The practical uses might surprise you.
- Learning and Curiosity: See how other websites are built. You can find the exact color code, font name, or layout structure another designer used.
- Testing and Previewing: Want to see if a heading would look better in blue? You can change it in 10 seconds without ever touching your website’s backend. This is perfect for quick visual experiments.
- Debugging and Troubleshooting: This is the big one for web creators. If something looks wrong on your site (like a ‘div’ being in the wrong place or an image being too big), Inspect Element is the number one tool for figuring out why.
- Checking Responsiveness: With its built-in device simulator, you can instantly see how your webpage looks on an iPhone, a Google Pixel, or a tablet.
The Most Important Rule: Your Edits Are Temporary and Local
Before we go any further, you must understand this one crucial fact: All changes you make with Inspect Element are 100% temporary and only visible to you.
You are not hacking the website. You are not editing the live server files. You are only changing the local copy of the site that your browser has downloaded. The moment you refresh the page (or close the tab), all your changes are gone forever.
This is what makes it a perfect sandbox. You can click, edit, and delete anything you want, and you have zero risk of breaking anything.
Key Takeaways
- What It Is: “Inspect Element” is a free developer tool in your browser to see and temporarily edit a website’s HTML and CSS.
- How to Open It: The easiest way is to right-click on any part of a webpage and select “Inspect” or “Inspect Element.”
- It’s 100% Safe: All your edits are temporary and local. They disappear when you refresh the page. You cannot break the website for anyone else.
- Core Panels: The Elements panel shows the HTML (structure), and the Styles panel shows the CSS (design).
- Common Uses: You can temporarily change text, edit colors and fonts, test mobile layouts, and find errors.
- The Limitation: You cannot save your changes. To make edits permanent, you must edit the website’s actual source files.
- The Real Solution: For permanent editing on your own WordPress site, a visual builder like Elementor gives you a similar “click-to-edit” experience but makes the changes permanent.
How to Open Inspect Element in Your Browser
Ready to try it? It’s easy. You have two main ways to open the developer tools on any webpage.
The Universal Shortcut: Right-Click
This is the simplest and most direct method.
- Move your mouse over any element on a webpage you want to inspect. It could be a piece of text, a button, or an image.
- Right-click on that element.
- From the context menu that appears, look for “Inspect” (on Chrome, Edge, Firefox) or “Inspect Element” (on Safari).
- Click it.
A new panel will pop up, and it will automatically highlight the exact line of HTML code that corresponds to the element you clicked on.
Keyboard Shortcuts
If you prefer, you can use a keyboard shortcut to open the developer tools. This usually opens the panel to its last-used tab.
| Browser | Windows / Linux | macOS |
| Google Chrome | F12 or Ctrl+Shift+I | Cmd+Opt+I |
| Mozilla Firefox | F12 or Ctrl+Shift+I | Cmd+Opt+I |
| Microsoft Edge | F12 or Ctrl+Shift+I | Cmd+Opt+I |
| Apple Safari | Cmd+Opt+I | Cmd+Opt+I |
A special note for Safari users: You must first enable the Develop menu.
- Go to Safari > Settings… (or Preferences…).
- Click the Advanced tab.
- At the very bottom, check the box that says “Show Develop menu in menu bar.”
- Now, you will see a new “Develop” menu in your menu bar, and the right-click “Inspect Element” option will be available.
Navigating the Developer Tools: A Beginner’s Guide
When you first open the developer tools, it can look intimidating. There are a lot of tabs, numbers, and lines of code. Do not worry. You only need to know about three or four key areas to be effective.
Let’s use Google Chrome’s “DevTools” as the example, but the layout is very similar in all other browsers.
The Elements Panel (Your HTML Structure)
This is the main view you see when you first open Inspect Element. It shows the Document Object Model (DOM), which is a fancy name for the live, structured-tree-view of the page’s HTML.
You can see the <html>, <head>, and <body> tags. You can click the little arrows to expand and collapse “nodes” to see what’s nested inside. When you right-clicked to inspect, this panel opened with the exact element you clicked already highlighted.
Pro-Tip: The single most useful tool here is the “Select an element” icon. It looks like a mouse cursor in a box. Click this icon, then move your mouse around the webpage. You will see elements get highlighted. When you click one, the Elements panel will automatically jump to and highlight its HTML code.
The Styles Panel (Your CSS Styles)
This is where the real magic happens for designers. This panel is usually nested inside the Elements panel (on Chrome/Edge) or right next to it. When you have an element selected in the HTML view, this panel shows you all the CSS rules that apply to it.
- You will see a list of CSS rules (e.g., color: #333;).
- You will see which file the style is coming from.
- You will see styles that are crossed out (strikethrough). This means another, more specific rule has overridden it. This is the “Cascading” part of CSS in action, and it’s the key to debugging style issues.
- The Box Model: At the bottom (or in its own “Computed” tab), you will see a diagram showing the element’s Box Model. This visualizes the content, padding, border, and margin. It’s incredibly useful for figuring out layout and spacing problems.
The Console Panel (Your JavaScript Log)
This is a tab you can click on. For a beginner, all you need to know is that this is where the browser reports errors. If you see red text in the Console, it often means some JavaScript on the page is broken, or an asset (like an image) is missing.
The Device Toolbar (Your Mobile Simulator)
This is a small icon at the top of the developer tools that looks like a phone and a tablet. When you click it, the webpage will instantly shrink into a “device” viewport.
You can then use a dropdown menu at the top of the screen to simulate dozens of popular devices, like an “iPhone 14 Pro,” “Samsung Galaxy S20,” or “iPad Air.” This is an essential, modern web design tool for checking if your site is responsive and easy to use on a mobile device.
Practical Walkthrough: 5 Simple Things You Can Do With Inspect Element
Let’s get our hands dirty. Open this (or any) webpage in a new tab and try these simple exercises.
1. How to Temporarily Change Text on a Web Page
This is the most common and fun thing to do.
- Find a piece of text on the page, like a heading or a link.
- Right-click the text and choose “Inspect.”
- The Elements panel will open with the HTML line highlighted. You will see your text right there, inside the HTML tags (e.g., <h2>Your Text Here</h2>).
- Double-click on the text inside the HTML tags. A text-editing cursor will appear.
- Type whatever you want.
- Press Enter on your keyboard.
That’s it. You have just “edited” the webpage. Take a screenshot to fool your friends. Remember, as soon as you hit refresh, your change is gone.
2. How to Temporarily Change Colors and Fonts
Let’s say you want to see what a button or heading would look like in a different color.
- Right-click the element (e.g., a blue button) and choose “Inspect.”
- Your element (<button> or <a>) will be highlighted in the Elements panel.
- Now, look at the Styles panel. Scroll through it until you find the CSS property you want to change. It will likely be background-color: #0073e6; or color: #ffffff;.
- Find the property and click on its value (e.g., click on #0073e6).
- You can now type a new value. Try red or #ff0000. As you type, the change happens live on the page.
- Even better, most browsers will show a small color swatch. Click that swatch to open a visual color picker. You can drag the picker around to find the perfect shade.
- Want to change the font? Look for the font-family property. Click its value and type in Arial, Verdana, or “Times New Roman”.
Pro-Tip: You can also add new styles. At the top of the Styles panel, there is usually a section called element.style. Click inside this section to add any CSS property you want, like font-size: 30px; or border: 5px solid red;.
3. How to See How a Site Looks on Mobile
This is a critical skill for any website owner.
- Open the developer tools (e.g., F12 or Cmd+Opt+I).
- Find the “Toggle device toolbar” icon. It looks like a phone and a tablet. Click it.
- Your webpage will resize inside a new frame. At the top of this frame, you will see a dropdown menu that probably says “Responsive” or “Dimensions.”
- Click this dropdown and select a specific device, like “iPhone 14” or “Pixel 7.”
- You can now interact with the website as if you were on that phone. Scroll, click links, and see how the layout, fonts, and menus adapt. This is the number one way to find and fix mobile usability issues.
4. How to Find and “Steal” (for Learning!) CSS Code
Let’s say you find a button on a website with a really cool hover effect. You can use Inspect Element to see exactly how it was made.
- Right-click the button and choose “Inspect.”
- With the button’s HTML highlighted, look at the Styles panel.
- Look for a button to “Toggle element state.” In Chrome, it’s a small icon that says :hov.
- Click this, and check the box for :hover.
- The browser will now “lock” the button in its hover state. The Styles panel will update to show you the CSS that only applies on hover (e.g., button:hover).
- Here, you might see properties like transform: scale(1.1); or transition: background-color 0.3s ease;.
This is how I learned CSS. I would find cool effects, inspect them, and see the exact properties and transitions the developer used. You can learn about amazing CSS properties this way.
Want to see some cool effects you could inspect? Check out this video on CSS Hover Effects to get some ideas: https://www.youtube.com/watch?v=sK7KajMZcmA
5. How to Check for Basic Errors (The Console)
Is your contact form not sending? Is an image on your site not loading? The Console is your first stop.
- Open the developer tools.
- Click the “Console” tab at the top.
- Look for any text that is colored red. Red text means errors.
- You might see an error like 404 (Not Found) next to an image file. This tells you the browser tried to load an image, but the link is broken.
- You might see Uncaught ReferenceError: someFunction is not defined. This means some JavaScript is broken, which could be why your form or slider is not working.
You do not need to understand what every error means. Just seeing the error and what file it’s related to gives you a huge clue about what to fix or who to ask for help.
The Big Limitation: How to Make Your Changes Permanent
Now we come to the most important part of this guide. You have spent an hour in Inspect Element, changed all the colors, re-written the text, and your site looks perfect.
Then you hit the Refresh button.
And it’s all gone.
As I mentioned, Inspect Element only edits the local copy. It never, ever edits the actual files on your website’s server. This is a feature, not a bug.
So, how do you make your changes permanent? You have to edit the source files of your website. How you do this depends entirely on how your website is built.
The WordPress Way: Using the Customizer for CSS
If you have a WordPress website, you have a simple way to make style changes permanent. Let’s say you used Inspect Element to find the perfect color for your post titles. The workflow is:
- Inspect: Right-click your post title and “Inspect.”
- Find the Selector: In the Styles panel, find the CSS “selector” that targets it. It will look something like .entry-title or .post-heading h2.
- Test the Style: In the element.style section, you typed color: #a12c5b; and it looks great.
- Make it Permanent:
- Go to your WordPress Dashboard.
- Navigate to Appearance > Customize.
- This will open the live “Customizer” for your theme.
- Find the section named “Additional CSS.”
In the text box, paste your new CSS rule:
.entry-title {
color: #a12c5b;
}
- You will see your change appear in the live preview.
- Click the “Publish” button.
Congratulations. You have just used Inspect Element as a testing ground to safely write CSS that is now live on your site.
The Problem with This Method
This is a great workflow, but it has limits.
- It only works for CSS. It does not work for changing text or HTML structure.
- You still have to write code.
- It can be slow. You have to find the selector, go to a different screen, paste the code, and publish.
- What about layout? Trying to change layouts (like column widths) with custom CSS is complex.
This is where we hit the ceiling of what traditional tools can do easily. This frustration is what led to the rise of a new, better way to build.
The Modern Solution: Why a Visual Builder Is What You’re Really Looking For
Think about the experience you just had with Inspect Element. You clicked on something, you saw a menu, and you changed a value. It was instant, visual, and intuitive.
What if you could have that exact experience, but all your changes were permanent and real?
This is the entire concept behind a visual website builder. As a WordPress expert, the tool I’ve built my career on is Elementor. It is a plugin that takes the standard WordPress system and gives it a live, front-end, visual editing interface.
It provides the “Inspect Element” experience but with the “Publish” power of the Customizer, all in one place.
How Elementor Solves the “Inspect Element” Workflow
Let’s re-do our earlier tasks, but this time with a visual builder.
- Changing Text: You do not right-click and “Inspect.” You just click on the text. A settings panel appears on the left. You type in the text box. It’s done. It’s saved.
- Changing Styles: You click the element. You go to the “Style” tab. You see clear controls labeled “Color,” “Typography,” and “Border.” You click the color picker and change the color. It’s done. It’s saved. No CSS selectors. No “Additional CSS” panel.
- Changing Layout: You do not futz with CSS margin or padding in the Box Model. You just grab an element and drag it. You want padding? You drag a slider.
- Responsiveness: Elementor has a built-in “Responsive Mode” that’s even easier than the browser’s developer tools. You can click the “Tablet” or “Mobile” icon and make changes that only apply to that device. You can set a different font size for mobile, and it just works, without you having to write a complex CSS “media query.”
The Expert’s View
As web creation expert Itamar Haim often says, “Inspect Element is the perfect tool for diagnosing a problem, but a visual builder like Elementor is the tool for solving it. It closes the gap between seeing what you want to change and actually changing it.”
Beyond Simple Edits: The Power of a Full Platform
Inspect Element can only modify what already exists. It cannot build a new “About Us” section from scratch.
This is where the concept of a visual builder evolves into a full platform. You are not just “inspecting,” you are creating.
- Building from Scratch: You can drag and drop widgets like “Image Gallery,” “Testimonial Carousel,” or “Contact Form” onto a blank page.
- Full Site Editing: With tools like Elementor Pro, you are not just editing a single page. You can visually build the parts of your theme, like your website’s header, footer, and blog post templates.
- eCommerce: You can use the WooCommerce Builder to visually design your product pages and shop archive, a process that used to require a team of developers.
- Integrated AI: You can even use Elementor AI to write the text or create a unique image for you, right inside the editor.
When you pair this with a fully optimized solution like Elementor Hosting, you get a single, seamless platform for building, managing, and growing your website, all from one visual interface.
Advanced “Inspect Element” Tricks for Power Users
While a visual builder is the ultimate solution for creating, Inspect Element remains the ultimate tool for debugging. Once you are comfortable with the basics, here are a few advanced tricks the pros use.
Simulating Slow Connections (Network Tab)
Your site might load fast on your high-speed internet, but what about a user on a shaky 3G connection?
- Open DevTools and click the “Network” tab.
- Find a dropdown that says “No throttling” or “Online.”
- Click it and choose “Slow 3G.”
- Now, refresh your page.
- You will feel the pain as your site slowly loads, asset by asset. This is the best way to see if your images are too big or if you have too many scripts.
Debugging :hover and :focus States
I mentioned this earlier, but it’s worth its own section. Trying to inspect a dropdown menu that disappears when you move your mouse is impossible. The solution is to force its state.
- Right-click the element before you hover (e.g., the main menu link).
- In the Styles panel, find the :hov (on Chrome/Edge) or “Toggle Element State” (on Firefox) button.
- Click it and check the :hover (or :focus) box.
- Now the element is “stuck” in that state, and you can move your mouse freely to inspect the dropdown menu’s styles.
Finding the Exact Image or Font File
Want to know what a file is named or how big it is?
- Open DevTools and click the “Network” tab.
- At the top, you can filter by type. Click “Img” or “Font.”
- Refresh the page.
- This panel will fill with every single image or font file loaded on the page. You can see its name, its file size, and how long it took to load.
Running Audits with Lighthouse
This is one of the most powerful tools, and it’s built right in.
- Open DevTools and find the “Lighthouse” tab.
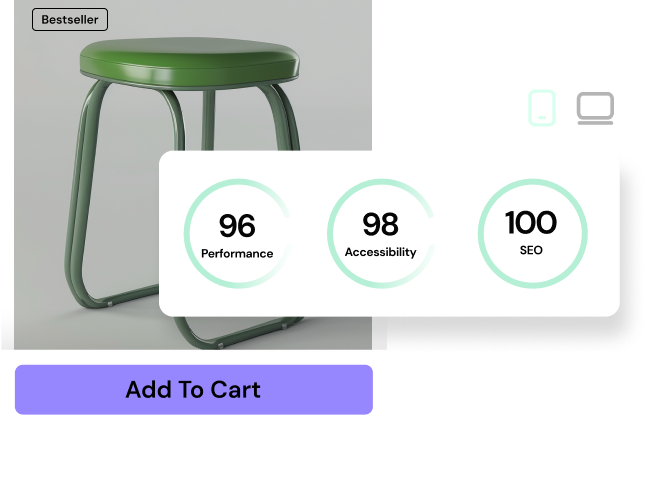
- You can check boxes for what you want to audit. The defaults are fine (Performance, Accessibility, SEO).
- Choose “Mobile” or “Desktop.”
- Click “Analyze page load.”
- After about a minute, Lighthouse will generate a comprehensive report with scores from 0-100. More importantly, it will give you actionable advice, like “Serve images in next-gen formats” or “Buttons do not have an accessible name.” This report is a professional-grade to-do list for improving your site.
Conclusion: From Inspector to Creator
The “Inspect Element” tool is the single most important gateway to understanding how the web is really built. It demystifies the entire process, changing the web from a series of static pages into a dynamic, editable system of HTML and CSS.
It is the essential tool for learning, for debugging, and for testing new ideas safely. But remember, it is a diagnostic tool. It’s the x-ray, not the scalpel.
Your journey starts with inspecting. But the goal is not just to look, it’s to create. When you are ready to make your changes permanent, you will need to edit your site’s source. And while you can do that by writing custom CSS, the modern, faster, and more powerful method is to use a visual platform.
By combining the diagnostic power of “Inspect Element” with the creative power of a tool like Elementor, you have the complete workflow of a professional web creator. You can find the problem, and you have the best tool to fix it.
Frequently Asked Questions (FAQ)
1. What is Inspect Element? Inspect Element is a tool built into all modern browsers that allows you to see and temporarily edit the HTML (structure) and CSS (style) of any webpage.
2. Will changes I make in Inspect Element break the website? No. Your changes are 100% temporary and only visible on your own computer. As soon as you refresh the page, all your edits will be gone. You cannot break the live website for anyone else.
3. Are my edits in Inspect Element visible to other people? No. The changes only exist in your browser’s local memory. No one else can see them.
4. How do I save my changes from Inspect Element? You cannot directly save changes. Inspect Element is a preview tool. To make a change permanent, you must edit your website’s actual source files. For a WordPress site, this often means adding code to the “Additional CSS” panel or, more easily, using a visual website builder like Elementor.
5. Can I use Inspect Element on my phone? Not easily. While some mobile browsers for developers have this feature, it’s not standard. The best way to check a mobile site is to use the “Device Toolbar” on your desktop browser, which simulates a mobile phone screen.
6. What’s the difference between “Inspect Element” and “View Source”? “View Source” (by right-clicking and choosing “View Page Source”) shows you the raw HTML file exactly as the server sent it. “Inspect Element” shows you the live, rendered DOM, which includes all modifications made by JavaScript after the page loaded. Inspect Element is dynamic and much more useful for debugging.
7. How can I find a specific CSS style for an element? Right-click the element, choose “Inspect,” and look at the “Styles” panel. This panel shows every CSS rule applied to that element, with the most specific ones at the top.
8. How do I see the box model (padding/margin)? Select an element, and in the “Styles” panel, look for a tab or section called “Computed.” This will show you a diagram of the element’s content, padding, border, and margin with their exact pixel values.
9. Why do some styles have a strikethrough in the Styles panel? A strikethrough (e.g., color: red;) means that this style was applied but was overridden by another, more specific CSS rule. This is the “cascade” in action, and it’s the key to understanding why a style might not be working. Look for the same property without a strikethrough to see the winning rule.
10. Is it illegal to use Inspect Element on other websites? Absolutely not. It is a fundamental, read-only tool for learning and debugging, provided by the browser manufacturers themselves. Every web developer in the world uses it. You are simply looking at the same public code your browser is already using to display the page.
Looking for fresh content?
By entering your email, you agree to receive Elementor emails, including marketing emails,
and agree to our Terms & Conditions and Privacy Policy.