Overview
The Elementor Debugger is a useful tool which helps you understand how a page has been built and more exactly it shows you which template of the builder is assigned to the page you are consulting. Learn more about Elementor’s Theme Builder templates.
Enable Elementor Debugger
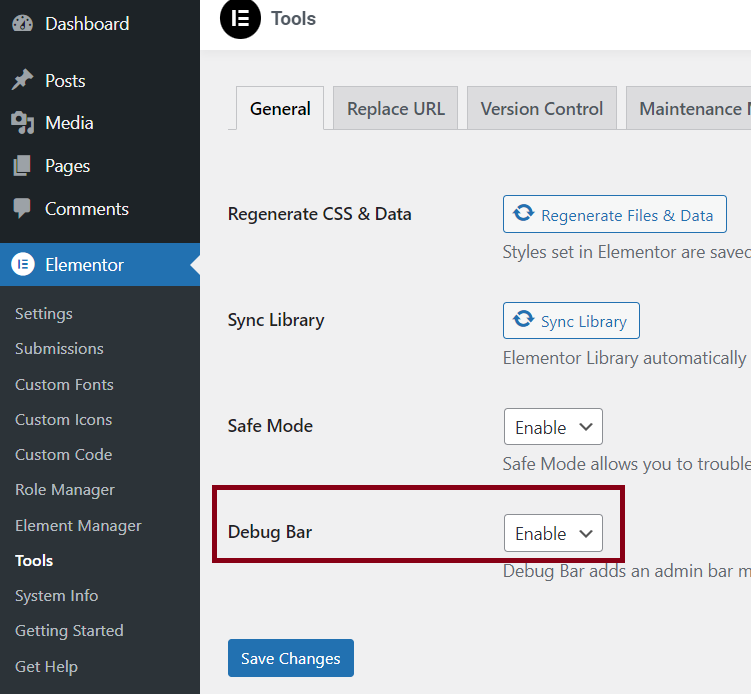
To enable Elementor Debugger, follow the below steps:
- Log in to WP Admin.
- Go to the Elementor > Tools > General.

- Select Enable for Debug Bar.
- Click Save Changes.
Use Elementor Debugger
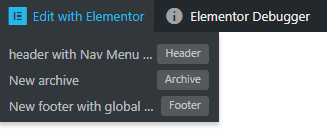
The Elementor Debugger is located next to the Edit with Elementor button on the front end and looks like this:

The example shows an author.php page. The Elementor Debugger shows you the following information:
| Items | Description |
|---|---|
| Header | Header template is called “header with Nav Menu widget” |
| Footer | Footer template is called “New footer with global widget” |
| Template | Template assigned to the page is called “New Archive”. |
| Skipped, is not Published | This means that there is a Header template in “my templates” which is saved as a draft and which is not assigned to this page. |
| no templates for conditions | This means that no template was assigned to the content of the specific page/post. |
| Template File: Location Settings (Override) > Elementor – header-footer.php | This means that the Footer and the Header of the theme have been overridden by Elementor. |
If you are a developer and want to create new locations, see Theme Locations.
When you hover over the button Edit with Elementor on the frontend, it gives you details about the current structure of the page.

In the example, you can see:
- Header template assigned to this page called “header with Nav Menu”
- Archive template called “New archive”
- Footer called “New footer with global”
This helps you to remember how you built each part of the page.

