Table of Contents
What Exactly Are Key Performance Indicators (KPIs)?
Before we get into the details, let’s make sure we agree on what KPIs actually are.
Defining KPIs: More Than Just Metrics
Think of KPIs as your website’s vital signs. They are specific, measurable values that show how well you are achieving key business objectives. They are not just random numbers. They are carefully chosen indicators that show performance related to your most important goals.
For example, simply tracking the number of website visitors is a metric. But tracking the ‘Percentage of Visitors who Complete a Purchase’ becomes a Key Performance Indicator if your main goal is to increase online sales. See the difference? A KPI connects directly to a strategic goal.
Why KPIs Matter for Your Website and Business
So, why bother with KPIs? Can’t you just build a great website and hope for the best? Well, you could, but tracking KPIs offers clear advantages:
- Focus: KPIs help you focus on what truly matters. Instead of getting lost in data, you watch the numbers directly linked to your success.
- Alignment: They make sure everyone on your team (or even just you!) understands the key targets and works toward the same goals.
- Informed Decision-Making: KPIs give you objective data to guide your strategies. Should you spend more on SEO or paid ads? Should you redesign a specific landing page? Your KPIs can help answer these questions.
- Accountability: They make progress (or lack of progress) visible and measurable. This encourages accountability.
- Progress Tracking: KPIs let you watch performance over time, spot trends, and see if your efforts are working. Are things getting better or worse? KPIs tell the story.
Without KPIs, you are basically flying blind. You would make decisions based on gut feelings instead of solid proof.
KPIs vs. Metrics: Understanding the Difference
People often confuse KPIs and metrics, so let’s clear this up.
- Metric: A number you can measure. Metrics track activity, but they don’t always show performance against a goal. Examples: page views, number of blog posts published, social media followers.
- Key Performance Indicator (KPI): A number you can measure used to check success against a specific strategic goal. KPIs are a small group of metrics that are most important for your goals. Examples: Conversion Rate, Customer Acquisition Cost, Website Traffic from Organic Search (if growing organic visibility is a goal).
Think of it like this: Your car’s dashboard has many gauges (metrics) like the odometer, fuel level, and engine temperature. But the speedometer (measuring speed) and fuel gauge (measuring range) are likely your Key Performance Indicators for reaching your destination safely and without running out of gas (your goals). All KPIs are metrics, but not all metrics are KPIs.
KPIs are vital, measurable values tied directly to your strategic goals. They differ from general metrics because they show performance against goals. They provide focus, help decision-making, and track progress. Knowing this difference is key for good measurement.
Choosing the Right KPIs for Your Goals
Okay, you understand why KPIs are important. But how do you choose the right ones? Tracking too many, or tracking the wrong ones, can be just as unhelpful as tracking none.
The SMART Framework for KPI Selection
A popular and useful way to define good KPIs is the SMART framework. Your chosen KPIs should be:
- Specific: Clearly defined. What exactly are you measuring? Instead of “Increase Website Engagement,” use “Increase Average Session Duration by 15%.”
- Measurable: You must be able to measure the KPI. How will you track it? Make sure you have the tools and methods to get the data reliably.
- Achievable: Set realistic targets. Aiming high is fine, but a KPI target should be reachable with effort. Setting impossible goals discourages everyone.
- Relevant: Does this KPI directly relate to a key business goal? Tracking ‘Likes’ on a social media post might not matter if your main goal is getting leads through your website forms. Make sure the KPI truly matters for your strategic success.
- Time-bound: Set a timeframe for reaching the target. This creates urgency and lets you review progress regularly. For example, “Increase Organic Search Traffic by 20% within the next Quarter.”
Using the SMART framework helps make sure your KPIs are practical and meaningful.
Aligning KPIs with Business Objectives
This is the most important step. Your KPIs must come directly from your main business goals.
- Start with your goals: What are you trying to achieve with your website?
- Increase sales?
- Generate more qualified leads?
- Improve brand awareness?
- Offer better customer support?
- Build an email list?
- Work backward: For each goal, ask: “What specific, measurable results show we are succeeding?”
- Goal: Increase Sales -> KPIs: E-commerce Conversion Rate, Average Order Value (AOV), Revenue per Visitor.
- Goal: Generate Leads -> KPIs: Form Submission Rate, Cost Per Lead (CPL), Number of Marketing Qualified Leads (MQLs).
- Goal: Improve Brand Awareness -> KPIs: Website Traffic (especially from channels like organic or social), Branded Search Volume, Social Media Mentions.
This top-down method makes sure your KPIs line up with your strategy and help reach the bigger picture.
Common Pitfalls to Avoid When Selecting KPIs
Watch out for these frequent mistakes:
- Vanity Metrics: Tracking numbers that look good but don’t affect business results (e.g., total page views without checking engagement or conversions).
- Tracking Too Many KPIs: This causes data overload and loss of focus. Stick to a few key indicators (often 3-5 per major goal).
- Not Aligning with Goals: Choosing KPIs because they are easy to track or popular, instead of choosing them because they measure progress toward your specific goals.
- Difficult/Impossible to Measure: Picking a KPI without having a reliable way to track the data accurately.
- Not Reviewing/Updating: Business goals change. Your KPIs should change too. Regularly check if your KPIs are still relevant and useful.
Choose KPIs carefully using the SMART framework (Specific, Measurable, Achievable, Relevant, Time-bound). Always connect your KPIs directly to your main business goals by starting with your goals and working backward. Avoid traps like vanity metrics, tracking too many KPIs, or choosing indicators that are irrelevant or hard to measure.
Essential KPIs for Website Success (Relevant to Elementor Users)
While the best KPIs depend on your specific goals, certain indicators are usually vital for most websites. This is especially true for sites focused on performance, user experience, and conversions – areas where tools like Elementor help. Let’s group them by category.
Traffic & Acquisition KPIs
These tell you about who visits your site and how they find you.
- Overall Website Traffic (Sessions, Users)
- What it is: The total number of visits (Sessions) and unique people (Users) coming to your site.
- Why it matters: Shows overall reach and site popularity. It’s a basic starting point but needs context from other KPIs.
- How to track: Google Analytics (GA4).
- Traffic Sources (Organic, Direct, Referral, Paid, Social)
- What it is: A breakdown of where your traffic comes from (e.g., search engines, typing URL directly, links from other sites, paid ads, social media).
- Why it matters: Shows which channels bring visitors. Helps you decide where to focus marketing efforts. Are your SEO efforts working (Organic)? Is your social media campaign effective (Social)?
- How to track: Google Analytics (GA4).
- New vs. Returning Visitors
- What it is: The ratio of first-time visitors compared to those who visited before.
- Why it matters: Shows reach (New) vs. loyalty/engagement (Returning). A healthy site usually needs a good balance.
- How to track: Google Analytics (GA4).
- Mobile vs. Desktop Traffic
- What it is: Percentage of visitors using mobile devices versus desktop computers.
- Why it matters: Vital for making sure your site works well on the most used device type. Since so many people use mobile, responsive design (a key part of building with Elementor) is essential. A bad mobile experience hurts KPIs.
- How to track: Google Analytics (GA4).
Engagement KPIs
These measure how visitors interact with your site after they arrive.
- Bounce Rate
- What it is: Percentage of visitors who leave your site after viewing only one page without doing anything. (Note: GA4 prefers ‘Engagement Rate,’ which is roughly the opposite).
- Why it matters: A high bounce rate can mean the content isn’t relevant, the user experience is bad, load times are slow, or traffic sources are misleading. But context is important (e.g., a blog post might naturally have a high bounce rate if users quickly find their answer).
- How to track: Google Analytics (GA4).
- Average Session Duration
- What it is: The average time visitors spend on your site in one visit.
- Why it matters: Usually, longer sessions mean higher engagement and interest in your content.
- How to track: Google Analytics (GA4).
- Pages Per Session
- What it is: The average number of pages a visitor looks at during a visit.
- Why it matters: Shows how much visitors explore your site. Higher numbers often mean better engagement and site navigation.
- How to track: Google Analytics (GA4).
- Scroll Depth
- What it is: How far down a page visitors usually scroll.
- Why it matters: Shows if users actually read your content or just look at the top. Important for long pages or landing pages.
- How to track: Google Analytics (GA4 Events), Heatmapping tools (like Hotjar, Microsoft Clarity).
- Interaction Rate (Clicks on specific CTAs, video plays)
- What it is: Tracks specific actions users take, like clicking buttons, playing videos, or downloading files. GA4 heavily focuses on these ‘Events’.
- Why it matters: Measures engagement with key parts of your pages. Are your Calls-to-Action working?
- How to track: Google Analytics (GA4 Event Tracking), Heatmapping tools.
Conversion KPIs
These are often the most important KPIs. They directly relate to reaching business goals like sales or leads.
- Conversion Rate (Overall and Goal-Specific)
- What it is: The percentage of visitors who complete an action you want (a ‘conversion’). This could be making a purchase, filling out a form, signing up for a newsletter, etc.
- Why it matters: The best measure of how well your website achieves its main goals. You can track the overall rate and rates for specific goals.
- How to track: Google Analytics (GA4 Conversions), E-commerce platforms, CRM data.
- Cost Per Acquisition (CPA) / Cost Per Lead (CPL)
- What it is: How much it costs, on average, to get one new customer (CPA) or one new lead (CPL). Calculate this by dividing total marketing cost by the number of acquisitions/leads.
- Why it matters: Measures how efficient your marketing campaigns are. A low CPA/CPL is usually better.
- How to track: Combine data from advertising platforms (Google Ads, Meta Ads) and your analytics/CRM.
- Form Submissions / Lead Generation Rate
- What it is: The number or rate of completed contact forms, quote requests, or other lead generation forms.
- Why it matters: Directly measures lead generation success. Elementor Pro’s Form widget makes creating and tracking these forms simple.
- How to track: Google Analytics (GA4 Events/Conversions), WordPress form plugins, CRM integrations.
- E-commerce Conversion Rate (if applicable)
- What it is: Percentage of visitors who make a purchase.
- Why it matters: The most direct measure of an online store’s success.
- How to track: Google Analytics (GA4 E-commerce Tracking), WooCommerce Analytics, Shopify Analytics.
- Average Order Value (AOV) (if applicable)
- What it is: The average amount spent each time a customer buys something on your site.
- Why it matters: Increasing AOV is a key way to raise revenue without needing more traffic or a higher conversion rate.
- How to track: Google Analytics (GA4 E-commerce Tracking), E-commerce platforms.
User Experience & Performance KPIs
These relate to how easily and quickly users can use your site. Bad performance here harms all other KPIs.
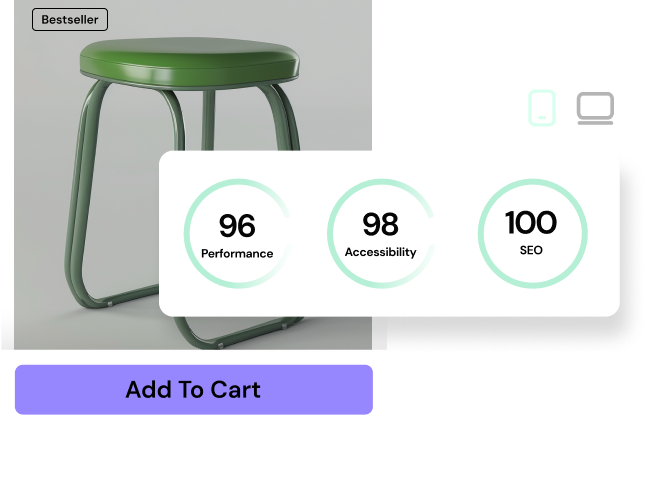
- Page Load Speed (Core Web Vitals – LCP, FID, CLS)
- What it is: How quickly your pages load and become usable. Google’s Core Web Vitals (Largest Contentful Paint, First Input Delay, Cumulative Layout Shift) are key metrics here.
- Why it matters: Slow sites frustrate users, increase bounce rates, hurt conversions, and damage SEO rankings. This is where Elementor’s performance features and good optimization really matter.
- How to track: Google PageSpeed Insights, Google Search Console (Core Web Vitals report), GTmetrix.
- Uptime / Availability
- What it is: The percentage of time your website is online and working.
- Why it matters: If your site is down, you get no traffic, users can’t engage, and they can’t convert. Aim for 99.9% uptime or higher.
- How to track: Uptime monitoring services (e.g., UptimeRobot, Pingdom), Hosting provider reports.
- Error Rate (404s, server errors)
- What it is: How often users see errors (like “Page Not Found” 404s or server problems).
- Why it matters: Errors create a very bad user experience and can stop users from doing what they came to do.
- How to track: Google Search Console (Coverage report), Website crawling tools (e.g., Screaming Frog), Server logs.
Business-Specific KPIs (Examples)
Depending on your business model, you might track broader KPIs that your website affects:
- Customer Lifetime Value (CLTV): Total money a business expects from one customer over time. Website experience affects customer loyalty.
- Customer Satisfaction (CSAT) / Net Promoter Score (NPS): Measures customer happiness. Often gathered through surveys shown on the website after an interaction.
- Churn Rate: The rate customers stop doing business with you (important for subscription services). A bad website experience can increase churn.
Key website KPIs include traffic (sources, users), engagement (bounce rate, time on site, interactions), conversions (rate, CPA, leads), and performance/UX (speed, uptime, errors). Pick the ones most relevant to your goals. Elementor users should focus on performance and conversion KPIs, as the platform offers tools to directly improve these areas.
How to Track and Measure Your KPIs Effectively
Choosing KPIs is only the first step. You need reliable ways to track them accurately and regularly.
Essential Tools for KPI Tracking
You don’t need tons of tools, but a few basic ones are vital:
- Google Analytics (GA4): The main tool for tracking website traffic, user behavior, conversions, and much more. It’s free and very powerful. Setting up GA4 correctly is essential.
- Google Search Console: Gives insights into your organic search performance, technical problems (like Core Web Vitals and errors), and how Google sees your site. Necessary for SEO-related KPIs.
- Heatmapping & Session Recording Tools: Tools like Hotjar or Microsoft Clarity let you visually see where users click, scroll, and move their mouse. You can even record anonymous user visits. Great for understanding why users act certain ways and finding user experience problems affecting engagement KPIs.
- CRM Systems (Customer Relationship Management): If you generate leads, a CRM (like HubSpot, Salesforce) tracks leads, sales, and customer interactions. This provides data for KPIs like CPL, CLTV, and conversion rates later in the process.
- WordPress Plugins: Many WordPress plugins help track specific data.
- Analytics Plugins: Easily add Google Analytics.
- Form Plugins: Often have built-in tracking for submissions (Elementor Pro’s Form widget works well here).
- E-commerce Plugins (WooCommerce): Give detailed sales and product performance data.
- Dedicated KPI Dashboard Software: Tools like Databox, Klipfolio, or Google Looker Studio let you pull data from different places into one dashboard for easy viewing and reporting.
Setting Up Tracking: A Practical Approach
- Install Tracking Codes: Make sure Google Analytics (and any other tool) tracking codes are correctly installed on every page of your site. Use integration plugins or Elementor’s Custom Code feature to add them easily.
- Define Goals/Conversions: Clearly set up your key conversions in Google Analytics (GA4). This tells GA what actions matter most (e.g., form submissions, purchases, specific page visits). You can’t track Conversion Rate without this.
- Enable E-commerce Tracking: If you have an online store, turn on enhanced e-commerce tracking in GA4. This captures detailed purchase and product data.
- Use UTM Parameters: Add UTM parameters to links in your marketing campaigns (email, social, ads). This helps GA4 accurately track traffic and conversions back to specific sources and campaigns.
- Regularly Audit: Check periodically that your tracking works correctly. Are goals recording data? Is the data consistent across different tools?
Establishing Baselines and Setting Targets
Once tracking is set up, let it run for a while (like a month) to set a baseline. This is your starting point. What are your current conversion rates, bounce rates, etc.?
Only after you have a baseline can you set realistic, SMART targets for improvement. For example, if your baseline conversion rate is 1.5%, a SMART target might be “Increase conversion rate to 2.0% within the next quarter.”
Good KPI tracking needs the right tools (GA4, Search Console are key) and correct setup (installing codes, defining conversions, using UTMs). First, find your baseline performance. Then, set SMART targets for improvement. Check your tracking regularly to make sure the data is accurate.
Analyzing KPI Data and Taking Action
Collecting data is useless if you don’t analyze it and use the information to make improvements. This is where KPIs provide real value.
Moving Beyond Raw Numbers: Context is Key
Don’t just look at one number alone. Context matters:
- Trends over Time: Is the KPI going up, down, or staying flat? A single number means little; the trend tells the real story.
- Comparisons: How does performance compare to past periods (last month, last year)? How does it compare to your targets?
- Segmentation: How do KPIs change for different groups (more on this below)?
For example, a 50% bounce rate might seem high. But if it’s lower than last month and mostly comes from blog traffic where users find quick answers, it might be okay.
Identifying Trends and Patterns
Regularly check your KPI dashboards (weekly or monthly is common). Look for:
- Big Changes: Any sudden jumps or drops? Find out why. Did a marketing campaign start? Was there a website change? A technical problem?
- Consistent Trends: Are certain KPIs slowly improving or getting worse? Understand what causes these long-term changes.
- Connections: Do changes in one KPI seem linked to changes in another? (e.g., does faster page load speed connect with a lower bounce rate and higher conversion rate?).
Segmenting Your Data for Deeper Insights
Looking at overall averages can hide important details. Break down your data into segments to find specific opportunities or problems:
- By Traffic Source: Do visitors from organic search convert better than visitors from social media? This helps you decide where to focus.
- By Device: Is the mobile conversion rate much lower than desktop? This points to possible mobile user experience issues.
- By Landing Page: Which pages lead to the most conversions? Which have the highest bounce rates? This helps you decide which pages to improve first.
- By User Demographics/Geography: Do certain age groups or locations perform better?
- By New vs. Returning Users: Do returning users engage more or convert at higher rates?
Google Analytics has powerful tools for segmentation. Use them!
A/B Testing and Experimentation
KPI analysis often leads to ideas about why performance is the way it is. For example, “I think changing the headline on this landing page will increase conversions.”
A/B testing (or split testing) is the scientific way to test these ideas. You create two versions of a page (A and B) with one key difference. You show each version to some of your audience. Then you measure which one performs better against your target KPI (like conversion rate).
Platforms like Elementor can help with A/B testing. They make it easy to copy pages and make changes. They often work with testing tools like Google Optimize (though it’s being phased out, alternatives exist) or VWO. Constantly testing different headlines, button text, layouts, and images based on KPI data is key to improving your site.
Creating Actionable Reports and Dashboards
Show your KPI data clearly. Good dashboards should:
- Focus on the Key Performance Indicators.
- Show data visually (charts, graphs).
- Display trends over time and comparisons to targets.
- Include short notes explaining big changes or insights.
- Be made for the audience (e.g., marketing team report vs. executive summary).
The goal is to understand performance and find areas that need attention quickly.
The Cycle of Measurement, Analysis, and Improvement
Managing KPIs is not a one-time job; it’s a continuous cycle:
- Measure: Track your chosen KPIs accurately.
- Analyze: Review the data, look for trends, segment, and find insights.
- Hypothesize: Create ideas for improvement based on the analysis.
- Test/Implement: Run A/B tests or make changes designed to improve KPIs.
- Measure Again: See if the changes positively affected your KPIs.
- Repeat.
This ongoing loop leads to small, steady improvements over time.
Analyzing KPIs means looking at trends, comparisons, and context, not just single numbers. Segment data (by source, device, page) for better insights. Use A/B testing to check ideas and improve performance. Create clear dashboards and follow the continuous cycle: measure, analyze, test, and improve.
How Elementor Helps You Impact Your KPIs
While KPIs measure results, the website itself drives performance. As an Elementor user, you have tools that directly help improve the metrics that matter most.
Building High-Converting Landing Pages
Elementor’s drag-and-drop editor, large widget library (especially forms, CTAs, testimonials in Pro), and template kits let you quickly create and adjust landing pages designed to convert. You can easily build pages focused on specific goals. This directly impacts your Conversion Rate and Lead Generation Rate KPIs.
Optimizing User Experience with Intuitive Design
A good user experience keeps visitors engaged. It guides them toward converting. Elementor’s visual builder lets you control layout, navigation, and design exactly how you want. This helps improve Bounce Rate, Average Session Duration, and Pages Per Session. Creating clear layouts and easy-to-follow paths is simple.
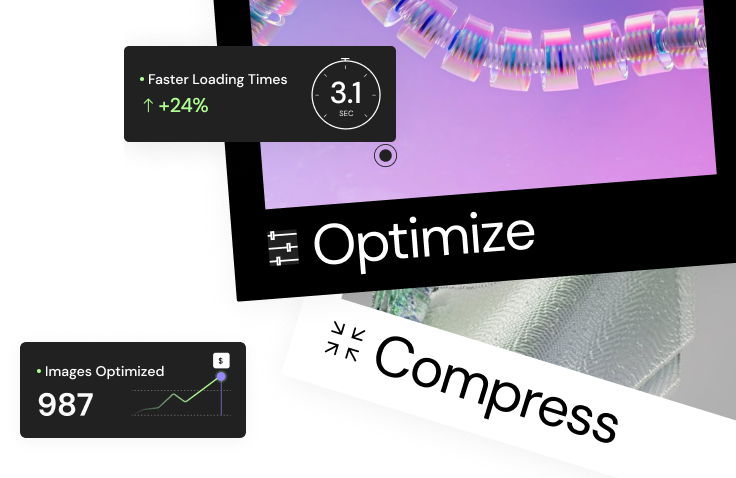
Improving Page Speed with Performance Features
Website speed is vital for both user experience and SEO. It directly affects Page Load Speed KPIs (Core Web Vitals). It also indirectly affects bounce and conversion rates. Elementor keeps working on performance. It offers features like better code output, loading assets only when needed, and working well with caching/optimization plugins. Building with performance in mind using these tools is important.
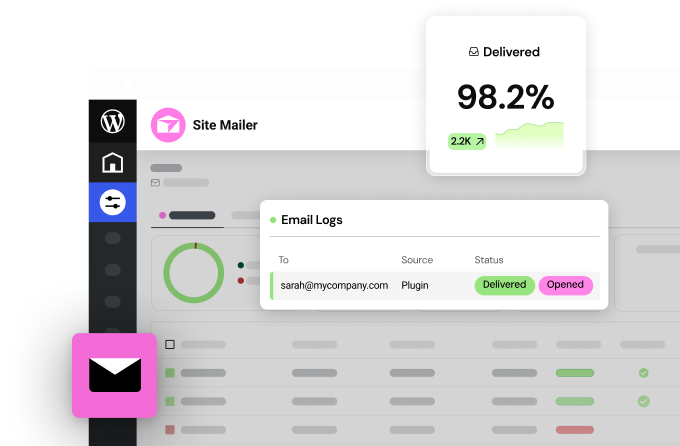
Seamless Integration with Marketing and Analytics Tools
Elementor connects easily with many key tools for KPI tracking and marketing. You can add Google Analytics codes, connect forms to CRMs and email services, and add tracking pixels for ad platforms. This smooth connection simplifies the setup needed to track KPIs like CPA/CPL and Form Submission Rate.
Facilitating A/B Testing for Continuous Optimization
Want to test if a different headline improves conversion rate? Elementor makes it easy to copy a page, make your change, and use other A/B testing tools or simple manual tests to compare performance. This ability to quickly change and test pages directly supports the Analysis and Improvement cycle driven by your KPIs.
By using these Elementor features wisely, focusing on performance, user experience, and clear calls-to-action, you can build websites that don’t just look great. They also perform very well against your key performance indicators.
Elementor gives you practical tools that help improve website KPIs. Its features help you build high-converting pages, improve user experience, increase page speed, connect tracking tools, and run A/B tests. All these actions are vital for boosting your key metrics.
Conclusion: Putting KPIs to Work for You
Key Performance Indicators are much more than just numbers. They are your map for navigating the digital world. They give you the clarity, focus, and data needed to make smart decisions, improve your website well, and finally reach your business goals.
Choosing the right KPIs that match your goals is step one. Tracking them accurately with tools like Google Analytics is next. Then, consistently analyze the information to take action. Remember the cycle: measure, analyze, test, improve, repeat.
By using KPIs and taking advantage of platforms like Elementor to improve user experience, performance, and conversions, you move from guessing to growing. So, define your goals, pick your KPIs, start tracking, and let the data guide you toward building truly successful websites. Good luck!
Looking for fresh content?
By entering your email, you agree to receive Elementor emails, including marketing emails,
and agree to our Terms & Conditions and Privacy Policy.