Table of Contents
If your site lags, you are losing customers, conversions, and ranking. The problem is, “speed” is a vague term. To fix a slow website, you first have to understand how to measure it. This guide will walk you through everything you need to know: what to measure, which tools to use, how to read their reports, and the first steps to take to fix your site.
Key Takeaways
- Speed is More Than One Metric: In 2026, speed is measured by Google’s Core Web Vitals: LCP (loading), INP (interactivity), and CLS (visual stability).
- INP is the New Standard: Interaction to Next Paint (INP) officially replaced First Input Delay (FID) in 2024. It measures your site’s total responsiveness, not just the first interaction.
- Lab vs. Field Data: You must understand the two types of data. Lab data (from tools like GTmetrix or Lighthouse) is a controlled test. Field data (from tools like PageSpeed Insights or Google Search Console) is real data from your actual visitors. Field data is what Google uses to rank you.
- Tools Have Different Jobs:
- PageSpeed Insights: Best all-in-one tool for both Field and Lab data.
- Google Search Console: Best for monitoring your entire site’s Core Web Vitals over time.
- GTmetrix & WebPageTest: Best for deep-dive diagnostics and “waterfall” charts to find bottlenecks.
- Optimization Starts at the Foundation: The most common speed problems are slow hosting (high TTFB), unoptimized images, and render-blocking code (CSS/JavaScript).
- An Optimized Stack Matters: Using an integrated system, like Elementor Hosting with its built-in performance features, caching, and the Image Optimizer plugin, can solve many of these issues from the start.
Why Website Speed is a Bottom-Line Issue
Before we get into the “how,” let’s lock in the “why.” Understanding this will motivate you to take action.
1. User Experience and Bounce Rate
This is the most obvious one. When a page is slow to load, users get frustrated. They feel like the site is broken or untrustworthy.
- Google/SOASTA research found that as page load time goes from 1 to 3 seconds, the probability of a user bouncing (leaving) increases by 32%.
- Go from 1 to 5 seconds, and the bounce probability increases by 90%.
A visitor who bounces is a lost opportunity. They didn’t read your article, subscribe to your newsletter, or buy your product.
2. SEO and Core Web Vitals
For years, Google has been clear that speed is a ranking signal. In 2026, this is non-negotiable. Google’s entire measurement for this is called the Core Web Vitals (CWV).
If your site has “Poor” Core Web Vitals, Google may rank your competitors higher, even if your content is better. Google doesn’t want to send its users to a frustrating experience.
3. Conversion Rates and Revenue
This is where it hits the wallet. Every second of delay has a direct, measurable impact on your revenue.
- A famous study by Deloitte showed that a 0.1-second improvement in site speed led to an 8.4% increase in conversions for retail sites.
- Conversely, a 1-second delay can consistently lead to a 7% drop in conversions.
For an eCommerce store doing $100,000 a year, a 1-second delay literally costs $7,000. This is not a technical problem. It’s a business problem.
Part 1: What to Measure (The Metrics That Matter in 2026)
The first step in testing your site is to know what you’re testing for. Stop thinking “is my site fast?” and start thinking “what is my LCP?” These are the key metrics.
Lab Data vs. Field Data: A Critical Distinction
You will see these two terms in all modern speed tools. You must know the difference.
- Lab Data: This is a simulated test run from a specific server in a controlled environment. Tools like GTmetrix, Pingdom, and the “Lab” section of PageSpeed Insights use this.
- Pros: Great for debugging. It’s consistent, so you can run a test, make a change, and run another test to see if you fixed it.
- Cons: It’s not the “real world.” It doesn’t know if your user is on a slow 4G connection in a rural area or on a spotty coffee shop Wi-Fi.
- Field Data: This is real-world data collected from your actual users who opted-in to sharing it via the Chrome browser. This is also called the Chrome User Experience Report (CrUX).
- Pros: This is the ultimate source of truth. It’s what Google actually uses to judge your Core Web Vitals for ranking.
- Cons: It’s an average taken over the last 28 days. It’s not good for instant debugging because you have to wait for new data to come in.
Your workflow should be: Use Field Data (in Google Search Console) to identify that you have a problem. Use Lab Data (in GTmetrix or PageSpeed Insights) to debug and fix the problem.
The 3 Core Web Vitals (LCP, INP, CLS)
These are the three metrics Google uses to give your site a “Good,” “Needs Improvement,” or “Poor” score.
1. Largest Contentful Paint (LCP)
- What it is: The time it takes for the largest “content” element (like a hero image, a video, or a large block of text) to become visible on the screen.
- What it measures: Perceived loading speed. It marks the point when the user feels the page is mostly loaded.
- What is a Good Score?
- Good: Under 2.5 seconds
- Needs Improvement: 2.5 to 4.0 seconds
- Poor: Over 4.0 seconds
- Common Causes of Poor LCP:
- Slow server response time (TTFB): Your hosting is slow.
- Render-blocking CSS and JavaScript: Code is loading before your main content and blocking it.
- Slow-loading resources: Your hero image is a massive 5MB file that hasn’t been compressed.
- Client-side rendering: Your site relies on a heavy JavaScript framework to build the page in the browser.
2. Interaction to Next Paint (INP)
- What it is: This is the big one that’s new for 2026. It replaced First Input Delay (FID) in March 2024. INP measures the total time it takes for the page to respond to a user’s interaction. This includes clicking a link, tapping a button, or (on mobile) tapping “add to cart.” It measures the entire interaction, from the click to the moment the screen visually updates (the “next paint”).
- What it measures: Interactivity and responsiveness. It answers: “When I click something, does the site feel fast or sluggish?”
- What is a Good Score?
- Good: Under 200 milliseconds
- Needs Improvement: 200ms to 500ms
- Poor: Over 500ms
- Common Causes of Poor INP:
- Heavy JavaScript: This is the #1 cause. The browser is too busy running other scripts to respond to your click.
- Long-running tasks: A single script is “hogging” the browser’s main thread.
- Large DOM Size: Your page has thousands of HTML elements, and the browser struggles to figure out what to change.
- Third-party scripts: That analytics or live-chat script you added is blocking user interactions.
3. Cumulative Layout Shift (CLS)
- What it is: A measure of how much your page layout jumps around while it’s loading. Think of when you try to click a button, but an ad loads above it and pushes the button down, making you click the ad instead. That’s a high CLS, and it’s incredibly frustrating.
- What it measures: Visual stability.
- What is a Good Score?
- Good: Under 0.1
- Needs Improvement: 0.1 to 0.25
- Poor: Over 0.25
- Common Causes of Poor CLS:
- Images without dimensions: You forgot to set the width and height attributes on your <img> tags. The browser doesn’t know how much space to save, so the text loads, and then the image pops in, pushing the text down.
- Dynamic content: Ads, banners, or “sign up for our newsletter” pop-ups that insert themselves into the page without a reserved space.
- Fonts loading late: The page first renders with a system font, and then your custom web font loads, causing a flash and a reflow of text.
Other Important Metrics to Know
You’ll see these in your reports. They are diagnostic metrics that help you fix the Core Web Vitals.
- Time to First Byte (TTFB): The time it takes from your click to the server sending back the first byte of data. This is a pure measure of your hosting and server health. A poor LCP is almost always preceded by a poor TTFB.
- First Contentful Paint (FCP): The time it takes for the very first piece of content (like the header or a bit of text) to appear. It answers: “Is the page working?”
- Total Blocking Time (TBT): This is the Lab data equivalent of INP. It measures how much time was “blocked” by scripts before the page was interactive. If you have a high TBT in your lab report, you almost certainly have a high INP in the field.
Part 2: How to Test Your Speed (The Top Tools)
Now that you know what to look for, let’s look at the tools to find them. You don’t need all of them. You need to know which one to use for which job.
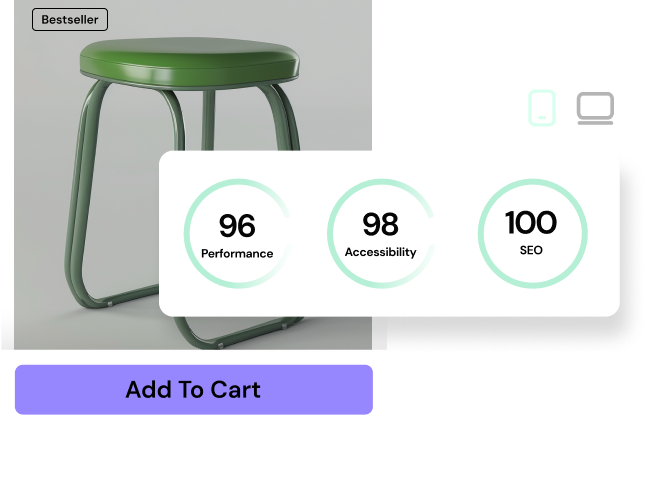
1. Google PageSpeed Insights (PSI)
This is your #1, all-in-one tool. It’s the only tool that conveniently shows you both field data and lab data in one report.
- Best for: Getting a complete picture. Seeing your real-world Core Web Vitals (Field) and then getting actionable lab diagnostics (Lab) all at once.
- How to Use It:
- Go to PageSpeed Insights.
- Enter the full URL of the page you want to test (e.g., httpss://yourdomain.com/product-page).
- Click “Analyze.”
- How to Read the Report:
- “Discover what your real users are experiencing” (Field Data): This is the box at the top. This is your 28-day CrUX report. It will give you a pass/fail for your Core Web Vitals. If your site is new or has low traffic, it might say “No data available.” This is the most important part of the report for Google.
- “Diagnose performance issues” (Lab Data): This is the second section. It’s a Lighthouse report (which we’ll cover next). This is your diagnostic data. It gives you a score from 0-100 and shows you LCP, INP, CLS, etc., for this one test.
- “Opportunities”: This section tells you what to fix. It will say things like “Properly size images,” “Reduce unused JavaScript,” or “Serve images in next-gen formats.”
- “Diagnostics”: This gives you more in-depth information, like “Avoid large layout shifts” (which points to CLS) or “Minimize main-thread work” (which points to INP).
2. Google Search Console
If PageSpeed Insights is your thermometer for a single page, Search Console is your hospital dashboard for the entire site.
- Best for: Monitoring your entire site’s Core Web Vitals over time. It’s not a “test” tool but a “monitoring” tool.
- How to Use It:
- If you haven’t, set up Google Search Console for your site. It’s free.
- In the left-hand menu, go to the “Experience” section.
- Click on “Core Web Vitals.”
- How to Read the Report:
- This report shows you your site’s field data (CrUX), just like PageSpeed Insights, but for your whole site.
- It groups all your URLs into “Good,” “Needs Improvement,” and “Poor.”
- You can click on the “Poor” or “Needs Improvement” reports to see groups of URLs that share the same problem (e.g., “CLS issue,” “LCP issue”).
- This is your optimization to-do list. Start with the “Poor” URLs and use PageSpeed Insights to debug them.
3. Chrome DevTools (Lighthouse)
This is the tool for developers and advanced users. It’s built right into your Chrome browser.
- Best for: Deep-dive debugging on your own computer. The Lighthouse report is the same lab report PageSpeed Insights gives you, but you can also use the “Performance” tab for a second-by-second breakdown.
- How to Use It:
- Open your website in Chrome.
- Right-click and select “Inspect,” or press F12 (Windows) or Cmd+Option+I (Mac).
- This opens the DevTools panel. Find the “Lighthouse” tab at the top.
- Select “Performance” from the categories.
- Choose a “Device” (always test on Mobile first!).
- Click “Analyze page load.”
- How to Read the Report:
- It will generate the exact same Lighthouse lab report you see in PageSpeed Insights.
- Pro Tip: Go to the “Performance” tab (next to Lighthouse). Click the “Reload” button (a circle arrow) to record a performance trace. This will generate a very complex “flame chart” that shows you exactly what script was running at what millisecond. It’s advanced, but it’s the ultimate tool for finding the specific script that’s causing your poor INP.
4. GTmetrix
This is a very popular third-party tool that’s a favorite among agencies and developers.
- Best for: Detailed waterfall charts and historical monitoring.
- How to Use It:
- Go to GTmetrix.com.
- Enter your URL and click “Test your site.” (A free account gives you more options, like testing from different locations).
- How to Read the Report:
- GTmetrix Grade: It gives you an easy-to-read “Performance” score.
- Web Vitals: It clearly displays your LCP, TBT (its lab version of INP), and CLS.
- The “Waterfall” Tab: This is the most powerful feature. It shows you a cascading chart of every single file your site loaded, in order.
- Look for long bars at the top. A long first bar is a slow TTFB.
- Look for “blocking” (red-tinted) bars. This is render-blocking JavaScript or CSS.
- Look for huge files. Is your background.jpg file 3MB? That’s a problem.
5. WebPageTest
This is the tool for performance experts. It’s the most advanced (and can be the most intimidating) tool on the list.
- Best for: Ultra-granular testing. Testing on real devices, from hundreds of global locations, and on specific network speeds (e.g., “Slow 4G”).
- How to Use It:
- Go to WebPageTest.org.
- Enter your URL.
- Carefully select your “Test Configuration”:
- Test Location: Choose a location that’s realistic for your users.
- Browser: Chrome is standard.
- Connection: This is key. Don’t just test on “Cable.” Test on “4G” or “Slow 4G” to simulate a real mobile user.
- How to Read the Report:
- It’s famous for its “filmstrip” view, which shows you a visual,-second-by-second snapshot of your page loading.
- It also has an advanced waterfall chart.
- It’s overkill for beginners, but it’s the final word in “what-if” scenario testing.
Part 3: How to Fix the Most Common Speed Problems
Testing is half the battle. Now you have a report that says “Reduce unused JavaScript” or “Serve images in next-gen formats.” What do you do?
Here is a practical, prioritized list of fixes, from easiest/most impactful to more advanced.
1. The Foundation: Fix Your Hosting (TTFB)
If your TTFB is high (over 600ms), nothing else matters. You can’t optimize your way out of a slow server. Your site is built on a weak foundation.
- The Problem: Your “Time to First Byte” is slow. This is often due to cheap, shared hosting where you are “sharing” resources with hundreds of other websites.
- The Fix:
- Enable Caching: This is the #1 fix. A caching plugin (like WP Rocket) or server-level caching takes a “snapshot” of your finished page and serves that static file to visitors. This dramatically reduces server work and TTFB.
- Get a Better Host: If caching isn’t enough, you’ve outgrown your host. You need to move.
- Use a CDN: A Content Delivery Network (CDN) stores copies of your site in servers all over the world. If a user visits from Australia, they get your site from a server in Sydney, not from your server in Texas.
- The Elementor Solution: This is where an integrated system shines. For example, Elementor Hosting is a managed platform built on the Google Cloud Platform. It’s specifically optimized for WordPress and Elementor, with server-level caching and a CDN (from Cloudflare) built-in. This one move solves TTFB, caching, and CDN issues all at once.
httpss://www.youtube.com/watch?v=sK7KajMZcmA
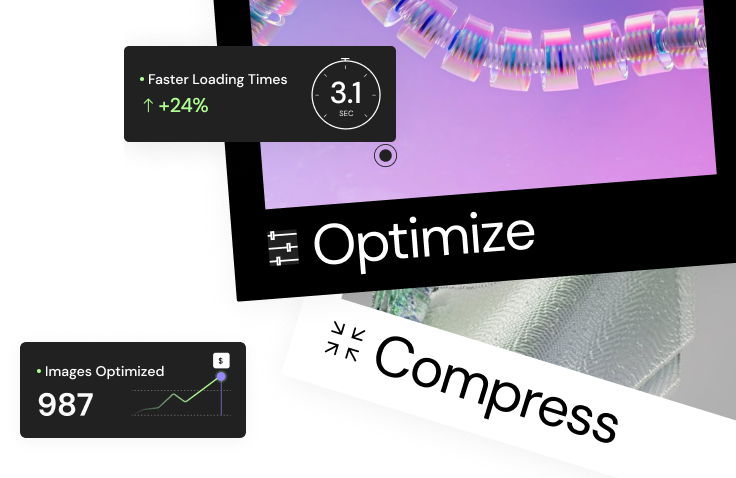
2. The Low-Hanging Fruit: Optimize Your Images
This is the most common problem I see. Your page is 8MB, and 7MB of that is images.
- The Problem: You uploaded a 4000×4000 pixel, 5MB PNG file for a 500×500 pixel display. The browser has to download that giant file and then shrink it. This kills LCP.
- The Fix:
- Resize: Never upload an image that’s wider than the largest it will ever be on your site (e.g., 1920px).
- Compress: Use a tool to reduce the file size without losing visual quality.
- Use Next-Gen Formats: Convert your JPEGs and PNGs to WebP or AVIF. These formats offer better compression and quality.
- The Elementor Solution: You can do this manually, but a plugin is much easier. The Elementor Image Optimizer plugin, for instance, can automatically compress and optimize your images on upload. It can also convert your entire media library to the WebP format.
3. The Technical Fixes: Tame Your Code (CSS & JS)
This is what causes high TBT and, in turn, high INP. Your browser is stuck reading a 500-page manual (your code) before it can respond to the user’s click.
- The Problem: Your site is loading tons of JavaScript and CSS that it doesn’t even need for the current page. This is “render-blocking” and “main-thread” work.
- The Fixes:
- Minify: Removes all the white space and comments from your code files to make them smaller.
- Combine (Sometimes): This is an older technique, but it can be useful to combine many small CSS files into one.
- Defer/Delay JavaScript: This is the big one. Tell the browser “Don’t load this script until the page is finished loading” (defer) or “Don’t load this script until a user scrolls near it” (delay). This is critical for third-party scripts like analytics, pixels, and chat widgets.
- The Elementor Solution: Elementor has many of these performance features built-in.
- Inside your Elementor dashboard, go to Settings > Features.
- Make sure “Optimized DOM Output” and “Improved Asset Loading” are active. This reduces the amount of code Elementor loads.
- You can also explore “Lazy Load” for images and videos.
- Elementor Pro users can also use the Custom Code feature to carefully place scripts where they are needed, rather than globally.
httpss://www.youtube.com/watch?v=QKd7d6LueH4
4. The Stability Fix: Stop the Jump (CLS)
This is the easiest one to fix and has a huge impact on user trust.
- The Problem: Your page elements are loading without reserved space, causing the layout to shift.
- The Fixes:
- Add width and height attributes to all images. This is the #1 fix. It tells the browser “Save a box this big for this image” before the image downloads.
- Reserve space for ads and iframes. If you’re going to have a banner ad, wrap it in a <div> that has a fixed height.
- Use font-display: swap for web fonts. This tells the browser to use a system font until the custom font is ready, and then “swap” it. This can cause a small flash but prevents a major layout reflow.
As web expert Itamar Haim often says, “A common mistake is loading an entire icon library just for one or two icons. It’s like sending a cargo truck to deliver a letter.” This principle applies to all your assets. Be intentional. Don’t load what you don’t need.
Part 4: Your 2026 Speed Testing Workflow
Don’t just test once. Make this a continuous process.
- Month 1 (Monitor): Use your Google Search Console Core Web Vitals report. This is your high-level dashboard. Wait for it to populate (it can take time). Identify the groups of URLs that are “Poor” or “Needs Improvement.”
- Week 1 (Triage): Take your most important “Poor” URLs (like your homepage or a key product page) and run them through PageSpeed Insights.
- Day 1 (Debug): Look at the “Opportunities” and “Diagnostics” in your PSI report. Is the problem “Slow TTFB”? Focus on your hosting/caching. Is it “Properly size images”? Focus on your images. Is it “Reduce main-thread work”? Focus on your JavaScript.
- Day 1 (Fix & Verify): Use a tool like GTmetrix or your Chrome DevTools (Lighthouse). Run a test. Make one change (e.g., install the Image Optimizer). Run the test again in an incognito window. Did the score improve? Did the waterfall get shorter? Yes? Great. Make the next change.
- Repeat: Go back to your list from Search Console and move to the next URL group.
Frequently Asked Questions (FAQ)
1. What is the most important website speed metric in 2026? There isn’t just one. Google uses the three Core Web Vitals (LCP, INP, CLS) together. However, the “newest” and most complex metric is INP (Interaction to Next Paint), which measures your site’s total responsiveness to user clicks and taps.
2. What’s the difference between Lab Data and Field Data? Field Data is real-world data from your actual visitors, averaged over 28 days. It’s what Google uses for ranking. Lab Data is a simulated test from a single location and device. It’s used for debugging, not ranking.
3. What replaced FID (First Input Delay)? INP (Interaction to Next Paint) replaced FID as a Core Web Vital in March 2024. FID only measured the delay before an interaction started, while INP measures the entire time it takes from the user’s click to the screen visually updating.
4. What is the best free tool for testing website speed? For most people, the best free tool is Google PageSpeed Insights. It’s the only tool that gives you both Field Data (from Google’s CrUX report) and a detailed Lab Data report (Lighthouse) in one place.
5. How do I fix a slow TTFB (Time to First Byte)? A slow TTFB is almost always a hosting problem. The top fixes are: 1) Enable server-side caching, 2) Use a CDN, and 3) Upgrade to a better, faster hosting provider, like a managed WordPress host.
6. What is the easiest way to speed up my website? The two easiest, most impactful fixes are: 1) Image Optimization (resizing, compressing, and using WebP) and 2) Caching (using a plugin or host-level caching).
7. How does Elementor help with website speed? Elementor has a suite of performance-focused solutions. This includes Elementor Hosting, which is a managed environment optimized for it; the Image Optimizer plugin, which handles compression and WebP conversion; and built-in features in the Elementor plugin itself (like “Improved Asset Loading”) that reduce the amount of code loaded per page.
8. What is a “waterfall chart”? A waterfall chart, found in tools like GTmetrix and WebPageTest, is a visual breakdown of every file your website loads (HTML, CSS, JS, images) and the order they load in. It’s the single best tool for finding “bottlenecks,” which appear as long bars in the chart.
9. My PageSpeed Insights score is low, but my site feels fast. What’s wrong? Your “felt” speed might be on a fast computer with a fast internet connection. PageSpeed Insights and Lighthouse test on a throttled, mid-range mobile device by default. This is to simulate how a real user on a 4G network experiences your site. Trust the mobile test, not your “felt” speed on a desktop.
10. How often should I test my website speed? You should do a deep-dive test (like this guide) every few months or after any major site change (like adding a new plugin or redesigning a page). You should monitor your speed continuously using the Core Web Vitals report in Google Search Console.
Looking for fresh content?
By entering your email, you agree to receive Elementor emails, including marketing emails,
and agree to our Terms & Conditions and Privacy Policy.