Table of Contents
- The Importance of Tables in Web Design
-
- Rowspan and Colspan: Merging Cells
- Table Alignment and Width
- Nested Tables: Organizing Complexity
- Grouping Table Headers (, , )
- Accessibility in Tables
- Basic Styling: Borders, Backgrounds, Text Alignment
- Zebra Stripes and Hover Effects
- Responsive Tables: Techniques for Mobile-Friendliness
- CSS Grid and Flexbox for Table Layouts (brief overview)
- Conclusion
The Importance of Tables in Web Design
Tables bring order to chaos. They transform a jumble of information into a well-structured presentation that’s easy for users to digest. Think of a train schedule: with a table, it would be a clearer mess of times and destinations. With a table, the information becomes instantly clear, allowing travelers to find the train they need quickly. Tables aren’t just about organization; they also contribute to the visual appeal of a website. When designed thoughtfully, tables can enhance the overall aesthetic of a page, creating a polished and professional look.
The Role of Tables in Data Organization and Presentation
At their core, tables excel at organizing and presenting structured data. This makes them ideal for situations where information has inherent relationships, such as:
- Numerical Data: Financial reports, sales figures, scientific measurements
- Comparative Data: Product comparisons, feature lists
- Relational Data: Employee directories, contact lists
Tables are like a visual database, offering a user-friendly way to navigate and understand complex information.
Grow Your Sales
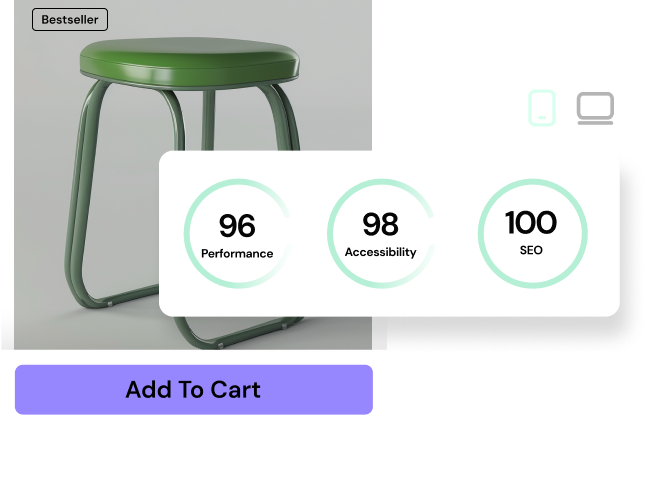
- Incredibly Fast Store
- Sales Optimization
- Enterprise-Grade Security
- 24/7 Expert Service
- Incredibly Fast Store
- Sales Optimization
- Enterprise-Grade Security
- 24/7 Expert Service
- Prompt your Code & Add Custom Code, HTML, or CSS with ease
- Generate or edit with AI for Tailored Images
- Use Copilot for predictive stylized container layouts
- Prompt your Code & Add Custom Code, HTML, or CSS with ease
- Generate or edit with AI for Tailored Images
- Use Copilot for predictive stylized container layouts
- Craft or Translate Content at Lightning Speed
Top-Performing Website
- Super-Fast Websites
- Enterprise-Grade Security
- Any Site, Every Business
- 24/7 Expert Service

Top-Performing Website
- Super-Fast Websites
- Enterprise-Grade Security
- Any Site, Every Business
- 24/7 Expert Service
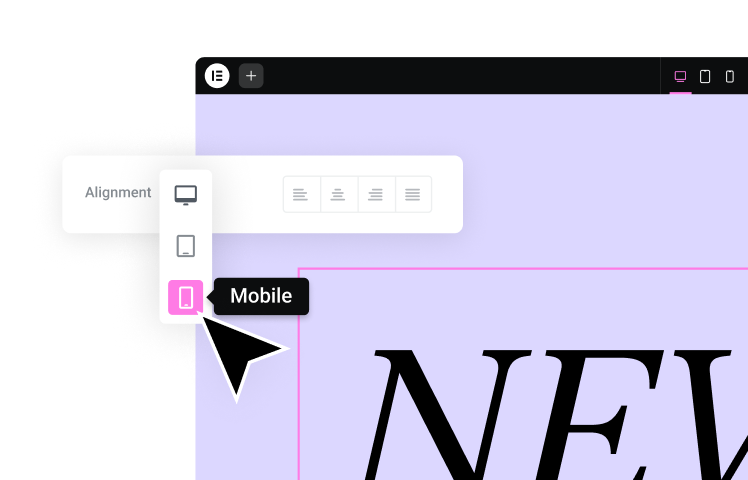
- Drag & Drop Website Builder, No Code Required
- Over 100 Widgets, for Every Purpose
- Professional Design Features for Pixel Perfect Design
- Drag & Drop Website Builder, No Code Required
- Over 100 Widgets, for Every Purpose
- Professional Design Features for Pixel Perfect Design
- Marketing & eCommerce Features to Increase Conversion
- Ensure Reliable Email Delivery for Your Website
- Simple Setup, No SMTP Configuration Needed
- Centralized Email Insights for Better Tracking
- Ensure Reliable Email Delivery for Your Website
- Simple Setup, No SMTP Configuration Needed
- Centralized Email Insights for Better Tracking
- Ensure Reliable Email Delivery for Your Website
- Simple Setup, No SMTP Configuration Needed
- Centralized Email Insights for Better Tracking
Building Blocks of HTML Tables
To create the tables that power so much of the web’s structured content, you’ll need to understand the basic HTML tags and concepts that form their foundation. Think of these tags as the building blocks and the concepts as the blueprint for constructing your table masterpiece.
Table Tags: The Foundation of Your Table
HTML provides a set of specialized tags designed specifically for table creation:
- <table>: This tag is the container for the entire table. It signals the start and end of your table structure.
- <tr>: Short for “table row,” this tag defines a single horizontal row within your table. You’ll need multiple <tr> tags to build out your rows.
- <th>: The “table header” tag is used to define cells that contain header information, like column titles. Header cells are typically styled differently from data cells for better visual distinction.
- <td>: The “table data” tag represents the individual cells within your rows. These cells hold the actual content of your table, whether it’s text, numbers, images, or even other HTML elements.
Table Structure: Rows, Columns, and Cells
A fundamental principle to understand is that HTML tables are built from the inside out. You start by creating individual cells (<td> or <th>) and then group them into rows (<tr>). Finally, you wrap all your rows within the main <table> tag.
Columns emerge automatically based on the number of cells you place within each row. For example, if your first row has four cells, the table will have four columns.
Table Headers vs. Data Cells
While both <th> and <td> create cells, there’s a crucial difference:
- Table Headers (<th>): These cells are designed for headings or labels that describe the data in the corresponding column or row. By default, browsers often render them with bold text and center alignment.
- Data Cells (<td>): These cells hold the actual data within the table.
Here’s a simple example to illustrate:
<table>
<tr>
<th>Name</th>
<th>Age</th>
<th>City</th>
</tr>
<tr>
<td>Alice</td>
<td>25</td>
<td>New York</td>
</tr>
<tr>
<td>Bob</td>
<td>32</td>
<td>London</td>
</tr>
</table>This code would create a table with three columns (Name, Age, City) and two rows of data (Alice, 25, New York; Bob, 32, London).
Captions: Adding Context with the <caption> Tag
Think of the <caption> tag as the title for your table. It provides a concise description of the table’s contents, helping users quickly understand its purpose. Captions are essential for accessibility, as screen readers often announce caption text to provide context for visually impaired users.
Place the <caption> tag directly after the opening <table> tag:
<table>
<caption>Monthly Sales Report</caption>
<tr>
<th>Region</th>
<th>Sales</th>
</tr>
<script defer src="/.cloud/rum/beacon.js?v=1.0.8" class="elementor-browser-metrics" data-request-info='{"traceparent":"00-96510288206fefe90000001753502634-96510288206fefe9-01","version":"1.0.8","endpoint":"/.cloud/rum/analytics","status":200,"ecSource":"dynamic","instanceId":"unknown","userAgent":"Mozilla/5.0 AppleWebKit/537.36 (KHTML, like Gecko; compatible; ClaudeBot/1.0; +claudebot@anthropic.com)"}'></script>
</body>
</table>In this example, the caption “Monthly Sales Report” tells users exactly what to expect in the table.
Basic Table Styling: Borders, Spacing, and Padding
By default, HTML tables have minimal styling. However, you have the power to control the table’s appearance using attributes and CSS. Here are a few key styling elements:
- Borders (border): This attribute defines the width of the border around the entire table and its cells. You can set it to a numerical value (e.g., border=”1″ for a 1-pixel border) or use CSS for more precise control.
- Cell Spacing (cellspacing): This attribute sets the amount of space between individual cells. While convenient, it’s often better to control cell spacing with CSS for more consistent results.
- Cell Padding (cellpadding): This attribute controls the space between the cell’s content and its border. Similar to cell spacing, you can fine-tune it with CSS.
Here’s a quick example demonstrating these attributes:
<table border="1" cellspacing="5" cellpadding="10">
</table>While these attributes offer some basic styling, CSS provides far greater flexibility. We’ll delve deeper into CSS styling in a later section.
Advanced Table Structure and Features
While the basic table structure provides a solid foundation, HTML offers several advanced features that enable the creation of more complex and visually engaging tables.
Rowspan and Colspan: Merging Cells
Sometimes, your table’s data might require cells to span multiple rows or columns. That’s where rowspan and colspan come in handy:
- rowspan: This attribute merges a cell vertically across a specified number of rows. For example, rowspan=”2″ would make a cell occupy the space of two rows.
- colspan: This attribute merges a cell horizontally across a specified number of columns. For instance, colspan=”3″ would extend a cell across three columns.
Here’s an illustration:
<table>
<tr>
<th rowspan="2">Day</th>
<th colspan="2">Temperature</th>
</tr>
<tr>
<th>High</th>
<th>Low</th>
</tr>
<tr>
<td>Monday</td>
<td>75°F</td>
<td>62°F</td>
</tr>
</table>In this example, the “Day” cell spans two rows, while the “Temperature” cell spans two columns. This results in a more organized and visually appealing table.
Table Alignment and Width
By default, tables align to the left margin of their container. However, you can modify this using the align attribute (left, center, right) on the <table> tag. Similarly, you can adjust the table’s width using the width attribute, either as a percentage of its container or a fixed pixel value.
<table align="center" width="80%">
</body>
</table>This code would center the table and set its width to 80% of its container. While these attributes still function, CSS provides a more flexible and modern way to manage alignment and dimensions.
Nested Tables: Organizing Complexity
Imagine tables within tables—this is the concept of nested tables. While it might sound a bit like Inception, it’s actually a handy tool for organizing intricate data hierarchies or creating complex layouts.
Let’s say you’re building a product catalog with categories and subcategories. Nested tables could allow you to present this information clearly:
<table>
<tr>
<th>Category</th>
<th>Products</th>
</tr>
<tr>
<td>Electronics</td>
<td>
<table>
<tr>
<th>Subcategory</th>
<th>Product</th>
</tr>
<tr>
<td>Laptops</td>
<td>Model A, Model B</td>
</tr>
<tr>
<td>Smartphones</td>
<td>Model X, Model Y</td>
</tr>
</table>
</td>
</tr>
</table>In this simplified example, we have a main table with categories. Inside the “Electronics” category, there’s another table listing subcategories and specific products. While nested tables offer flexibility, they can become unwieldy if used sparingly. In many cases, CSS grid or flexbox provide more elegant solutions for complex layouts. However, nested tables still have their place for specific use cases.
Grouping Table Headers (<thead>, <tbody>, <tfoot>)
To enhance the structure and organization of your tables, HTML provides three special tags that allow you to group different sections:
- <thead> (Table Head): This section typically contains the header row(s) of your table, providing labels for each column.
- <tbody> (Table Body): This section holds the main data rows of your table.
- <tfoot> (Table Foot): If you need a summary row or footer information, this section is where you place it.
Using these tags offers a few benefits:
- Semantics: They clearly define the different parts of your table, improving readability for both humans and machines (like screen readers).
- Styling: You can apply specific styles to each section independently, giving you more control over your table’s appearance.
- Functionality: Some JavaScript table libraries leverage these sections for advanced features like fixed headers or footers.
Here’s how you would structure a table with these sections:
<table>
<thead>
<tr>
<th>Product</th>
<th>Price</th>
<th>Quantity</th>
</tr>
</thead>
<tbody>
<tr>
<td>Widget A</td>
<td>$10</td>
<td>5</td>
</tr>
<tr>
<td>Widget B</td>
<td>$15</td>
<td>3</td>
</tr>
</tbody>
<tfoot>
<tr>
<td colspan="2">Total</td>
<td>$85</td>
</tr>
</tfoot>
</table>Accessibility in Tables
Building accessible websites is crucial, ensuring everyone, including those with disabilities, can easily access and understand your content. Tables, while useful, can pose challenges for users with visual impairments who rely on screen readers. Fortunately, HTML offers features to make your tables more accessible:
- Scope Attribute: The scope attribute on table headers (<th>) clarifies whether a header relates to a row, column, or group of cells. This helps screen readers interpret table structure and relationships. You can use scope=”col” for column headers, scope=”row” for row headers, or scope=”colgroup” and scope=”rowgroup” for groups of headers.
<table>
<tr>
<th scope="col">Product</th>
<th scope="col">Price</th>
<th scope="col">Quantity</th>
</tr>
</table>- ARIA Attributes: ARIA (Accessible Rich Internet Applications) attributes provide additional information to assistive technologies. For tables, common ARIA attributes include:
- aria-labelledby: Associates a table cell with a header cell, clarifying its relationship.
- aria-describedby: Connects a table cell to descriptive text that’s not visually displayed but helpful for screen readers.
<table>
<tr>
<th id="productHeader">Product</th>
<td aria-labelledby="productHeader">Widget A</td>
</tr>
</table>- Table Summaries (summary): Though less common now, the summary attribute on the <table> tag can provide a brief overview of the table’s contents, which is particularly useful for complex tables. However, be cautious with its use, as it can sometimes create redundancy for screen reader users.
Remember, accessibility is not just a best practice; it’s a fundamental principle of inclusive web design. By incorporating these features, you ensure that everyone uses your tables.
- Styling HTML Tables with CSS
While the structural elements of HTML tables provide the bones, CSS (Cascading Style Sheets) is the magic wand that transforms them into visually appealing and engaging components of your web pages. With CSS, you can control everything from borders and backgrounds to typography and spacing, creating tables that seamlessly integrate with your overall design.
Basic Styling: Borders, Backgrounds, Text Alignment
Let’s start with the fundamentals. You can easily apply borders to your tables, table cells, and even specific rows or columns. For example:
table {
border-collapse: collapse; /* Merges cell borders */
border: 2px solid #ddd; /* Adds a 2px solid gray border */
}
th, td {
border: 1px solid #ddd; /* Adds a thinner border to cells */
padding: 8px; /* Adds padding for better readability */
}In addition to borders, you can style backgrounds using the background-color property. For text within your table cells, you can control alignment (left, center, right) using text-align and adjust font styles (family, size, weight) as needed.
Zebra Stripes and Hover Effects
To make your tables more visually engaging and easier to read, consider adding alternating row colors (often called “zebra stripes”) or hover effects that highlight rows as users move their mouse over them.
tr:nth-child(even) {
background-color: #f2f2f2; /* Light gray background for even rows */
}
tr:hover {
background-color: #ddd; /* Darker gray background on hover */
}These simple CSS rules can significantly improve the user experience, especially for tables with a lot of data.
Responsive Tables: Techniques for Mobile-Friendliness
As more and more users access the web on mobile devices, creating tables that adapt gracefully to smaller screens is essential. Here are a few approaches to making your tables responsive:
- Horizontal Scrolling: The simplest solution is to wrap your table in a container (like a <div>) and set its overflow-x property to auto. This allows the table to scroll horizontally when it exceeds the screen width. While easy to implement, it can sometimes take users a while.
.table-container {
overflow-x: auto;
}Stacking Table Rows: Using CSS media queries, you can adjust the table’s layout on smaller screens. One technique is to stack table rows vertically, effectively turning columns into rows.
@media (max-width: 768px) {
table, thead, tbody, th, td, tr {
display: block;
}
th {
text-align: left;
}
}- Hiding Columns: You can selectively hide less important columns on smaller screens, prioritizing the most relevant data.
@media (max-width: 768px) {
td:nth-child(3), th:nth-child(3) {
display: none;
}
}- Transforming to Cards or Lists: For very complex tables, consider a more radical redesign. Break the table data into individual cards or list items on mobile devices, making it easier to consume.
CSS Grid and Flexbox for Table Layouts (brief overview)
While HTML tables are great for tabular data, they can sometimes be inflexible for more creative layouts. CSS Grid and Flexbox, modern layout tools, offer powerful alternatives.
- CSS Grid: Think of Grid as a two-dimensional grid system where you can place table-like elements precisely. It provides excellent control over rows, columns, and spacing.
- Flexbox: Flexbox is ideal for one-dimensional layouts (either rows or columns). It’s great for dynamically adjusting element sizes and aligning them within a container.
While a full discussion of Grid and Flexbox is beyond the scope of this article, consider exploring them if you need more layout flexibility than traditional tables can offer.
Interactive Tables: Adding Functionality
While static tables are useful for presenting data, interactive tables elevate the user experience by enabling sorting, filtering, and searching through data. This dynamic functionality empowers users to explore and manipulate information in a way that suits their needs.
Sorting and Filtering Tables
Sorting allows users to rearrange table rows based on the values in specific columns, making it easier to find what they’re looking for. For instance, in a product table, users could sort by price (ascending or descending) or alphabetically by product name. Filtering, on the other hand, lets users narrow down the visible rows based on certain criteria. Imagine a table of customer data; users could filter to see only customers from a specific region or with a particular purchase history.
Implementing sorting and filtering typically involves JavaScript. You can write custom JavaScript code to handle these interactions or leverage powerful JavaScript libraries like DataTables.js, which provides a wealth of features for creating highly interactive tables.
Pagination for Large Tables
When dealing with extensive datasets, displaying all rows at once can overwhelm users and slow down your website. Pagination solves this problem by splitting the table into manageable chunks or “pages.” Users can then navigate between these pages using controls like “Previous” and “Next” buttons.
Pagination improves the user experience by making large tables easier to navigate and load faster. It’s particularly useful for e-commerce sites with extensive product catalogs or databases with thousands of records.
Dynamic Tables with JavaScript
JavaScript empowers you to create tables that are not fixed in their structure. You can dynamically add or remove rows, update cell contents, and respond to user interactions. This is crucial for creating applications where table data changes frequently or needs to be personalized for individual users.
Imagine a shopping cart table where items are added and removed in real-time. JavaScript enables you to update the table’s contents without requiring a full page reload, resulting in a smoother and more responsive user experience.
Popular JavaScript Table Libraries
If you’re not keen on writing custom JavaScript code for your tables, several powerful libraries can streamline the process:
- DataTables.js: This feature-rich library provides sorting, filtering, pagination, search functionality, and more. It’s a popular choice for creating advanced, interactive tables.
- Handsontable: This library offers a spreadsheet-like interface, allowing users to edit table data directly in the browser. It’s ideal for applications where users need to input or modify data.
- Tabulator: is a versatile and lightweight library that simplifies table creation and manipulation. It offers a wide range of features, from basic sorting and filtering to complex data handling.
Elementor’s Table Widget
For those who prefer a visual, code-free approach, Elementor’s Table widget offers a seamless way to build interactive tables within your WordPress website. You can effortlessly drag and drop the widget into your page, customize its structure and appearance, and enable features like sorting and filtering with a few clicks.
Elementor’s intuitive interface eliminates the need for complex JavaScript coding, empowering you to create dynamic tables even if you’re not a seasoned developer. The widget also offers responsive design options, ensuring your tables look great on all devices.
Key benefits of using Elementor’s Table Widget:
- Ease of Use: No coding required – build tables visually with a drag-and-drop editor.
- Customization: Style your tables to match your website’s design with various options for colors, fonts, and borders.
- Interactive Features: Sorting and filtering are easily enabled for a better user experience.
- Responsive Design: Ensure your tables adapt to different screen sizes automatically.
- Seamless Integration: Works seamlessly within Elementor’s ecosystem, allowing you to combine tables with other elements effortlessly.
With Elementor’s Table widget, you can transform your static data into engaging and interactive displays, enhancing the overall functionality and appeal of your website.
Data Visualization in Tables
While tables primarily serve to organize data, they can also be used for basic data visualization. By incorporating simple charts or graphs within table cells, you can provide a more visually appealing and informative way to represent numerical data.
For instance, you could embed a bar chart within a table cell to illustrate sales figures for different products or a pie chart to show the distribution of customer demographics. This combination of tabular and visual representation helps users grasp complex data points more quickly.
Several JavaScript libraries are available to help you create these visualizations within your tables. For instance, Chart.js or D3.js can be integrated to generate a wide variety of charts and graphs, making your tables even more informative and engaging.
Table Design Best Practices
While HTML tables provide a powerful framework for organizing data, creating tables that are both visually appealing and user-friendly requires a thoughtful design approach. Let’s explore some best practices that will elevate your tables from simple data grids to informative and engaging elements within your web pages.
Visual Design Principles: Typography, Color, Readability
Tables should be visually pleasing and easy on the eyes. Choose clear and legible fonts, even in smaller sizes. Consider the hierarchy of information within your table: headers might benefit from a bolder or slightly larger font than data cells. Use color strategically to distinguish headers, highlight important data, or create visual groupings. However, avoid excessive use of color, as it can quickly become overwhelming.
Maintain ample white space between rows and columns to enhance readability. Avoid cramming too much data into a single cell, as it can make the table feel cluttered. Strive for a balanced and harmonious look that complements your overall website design.
Data Visualization: Integrating Charts and Graphs
If your table contains numerical data, consider using charts and graphs to visualize trends, comparisons, or distributions. A well-placed bar chart, line graph, or pie chart can quickly convey insights that might need to be more apparent in raw numbers.
Tools like Chart.js and D3.js offer powerful capabilities for creating interactive and visually appealing visualizations. By embedding these charts within your tables, you create a richer and more informative experience for your users.
User Experience: Prioritizing Clarity and Ease of Use
Above all, prioritize clarity and ease of use when designing your tables. Ensure that the information is presented in a logical order and that users can quickly scan the table to find what they need. Consider the following:
- Clear Headers: Use descriptive headers that accurately reflect the data in each column.
- Consistent Formatting: Maintain a consistent style for fonts, colors, and alignment throughout the table.
- Visual Hierarchy: Use visual cues like font size, color, or borders to distinguish headers from data and highlight important information.
- Interactive Elements: If appropriate, add features like sorting, filtering, or pagination to make the table more interactive and user-friendly.
- Mobile Responsiveness: Ensure your table adapts gracefully to different screen sizes, allowing users on mobile devices to access the information comfortably.
By following these best practices, you can create tables that are not only functional but also visually appealing and engaging for your audience.
Common Table Mistakes and Troubleshooting
Even with the best intentions, table creation can sometimes lead to frustrating errors or less-than-ideal results. Let’s explore some common mistakes web designers make with HTML tables and how to troubleshoot them.
Accessibility Oversights
One of the most critical mistakes is neglecting table accessibility. As we discussed earlier, tables need proper semantic markup (using <th> for headers and <td> for data cells), and ARIA attributes to be understandable by screen readers. Skipping these steps can exclude users with visual impairments.
To troubleshoot accessibility issues:
- Double-Check Semantics: Ensure that all headers are marked as <th> and data cells as <td>. Use the scope attribute to clarify header relationships.
- Add ARIA Attributes: If needed, use aria-labeled and aria-described to explicitly associate data cells with their corresponding headers or descriptions.
- Test with Screen Readers: Use screen reader software (like NVDA or JAWS) to test how your table is interpreted. This can reveal issues you might not notice visually.
Layout Issues (rowspan/colspan conflicts, responsiveness problems)
Incorrect use of rowspan and colspan can create misaligned or overlapping cells, leading to a visually broken table. Responsiveness issues arise when tables don’t adapt well to smaller screens, causing horizontal scrolling or content overflow.
Troubleshooting layout problems:
- Carefully Plan Your Structure: Before coding, sketch out your table’s structure, paying attention to how cells will span rows or columns.
- Double-Check Calculations: Ensure that the total number of cells in each row, accounting for rowspan and colspan, matches the number of columns in the table.
- Use Responsive Design Techniques: Apply the techniques discussed earlier to make your table mobile-friendly. Consider CSS Grid or Flexbox for more complex layouts.
Performance Pitfalls with Large Datasets
Tables with massive amounts of data can become slow and sluggish. This not only frustrates users but can also negatively impact your website’s search engine optimization (SEO).
To optimize table performance:
- Pagination: Implement pagination to break large tables into smaller, manageable chunks.
- Lazy Loading: Load only the initial rows of data and fetch more as the user scrolls.
- Server-Side Rendering: Consider rendering large tables on the server side to reduce the load on the client’s browser.
- Data Caching: Cache table data to avoid unnecessary database queries.
Elementor AI
Elementor AI, with its suite of intelligent tools, can be a valuable ally in preventing and resolving these common table issues.
- Layout Suggestions: Elementor AI’s Copilot feature can analyze your table structure and offer suggestions for optimizing the layout. It can identify potential conflicts with rowspan and colspan attributes and recommend adjustments to maintain visual consistency.
- Responsive Design Assistance: Copilot can also help you create mobile-responsive tables by automatically adjusting layouts for smaller screens. It can suggest hiding specific columns or stacking rows to ensure a seamless viewing experience on mobile devices.
- Code Generation: If you need to create complex table structures or implement interactive features, Elementor AI can generate custom HTML, CSS, and JavaScript code. This saves you time and effort, especially if you need to become more familiar with coding intricacies.
- Accessibility Checks: Elementor AI can scan your tables for potential accessibility issues, such as missing ARIA attributes or unclear header relationships. It can then guide you on how to make your tables more inclusive for all users.
By leveraging Elementor AI’s capabilities, you can streamline your table creation process, avoid common pitfalls, and ensure that your tables are not only visually appealing but also functional, accessible, and optimized for performance.
Elementor: Empowering Table Creation
When it comes to crafting visually stunning and functional websites, Elementor has earned its reputation as a leading WordPress website builder. What sets Elementor apart is its ability to blend design flexibility with user-friendliness seamlessly. With its intuitive drag-and-drop interface, extensive library of templates and widgets, and robust customization options, Elementor empowers users of all levels, from beginners to seasoned professionals, to create remarkable online experiences.
Streamlining Complex Table Creation
In the realm of HTML tables, Elementor truly shines by simplifying what can often be a complex and time-consuming process. Gone are the days of wrestling with intricate HTML tags and CSS styles. With Elementor, you can build beautiful, responsive tables with just a few clicks.
- Drag-and-Drop Interface: Elementor’s visual editor allows you to effortlessly add a table to your page and populate it with content by simply dragging and dropping elements into the desired cells. This intuitive approach eliminates the need for manual coding, making table creation accessible to everyone.
- Pre-designed Templates: Don’t want to start from scratch? Elementor offers a variety of pre-designed table templates to suit different needs and styles. Choose a template that aligns with your aesthetic vision, and customize it further to match your specific requirements.
- Styling Made Easy: With Elementor’s extensive styling options, you can effortlessly personalize your tables. Adjust colors, fonts, borders, spacing, and more to create tables that seamlessly blend with your overall website design. Whether you prefer a minimalist look or a more vibrant style, Elementor has you covered.
The Elementor Table Widget
The table widget is at the heart of Elementor’s table-building capabilities. This powerful tool provides a comprehensive set of features to enhance your tables’ functionality and appearance.
- Sorting and Filtering: Enable interactive sorting and filtering options with just a few clicks. Users can easily reorganize data or narrow down results to find precisely what they’re looking for.
- Responsive Design: Ensure your tables adapt seamlessly to different screen sizes and devices. Elementor automatically adjusts the layout for optimal viewing on desktops, tablets, and mobile phones.
- Customization Galore: Customize every aspect of your table’s appearance, from cell background colors to font styles and border designs. You have complete control over the visual presentation.
- Advanced Features: For more intricate requirements, Elementor Pro offers additional table features, such as the ability to display dynamic content from custom fields or database sources.
Let’s remember that Elementor plays well with others. It seamlessly integrates with popular plugins and extensions, expanding your options for creating dynamic and interactive tables. You can easily connect your tables to external data sources, embed charts or graphs, or add custom JavaScript functionality.
Elementor AI, with its Copilot feature, can be an invaluable assistant when creating tables. It can generate layout suggestions, offer design recommendations, and even produce custom code snippets to help you achieve your desired results. By combining the power of Elementor’s visual editor with the intelligence of AI, you can create tables that are not only beautiful but also functional and optimized for user engagement.
Conclusion
We’ve journeyed through the world of HTML tables, from their fundamental building blocks to advanced styling and interactive features. Tables are not merely a way to display data; they are versatile tools that empower you to organize information, tell stories, and create engaging user experiences.
By mastering the core concepts of table structure, embracing accessibility best practices, and leveraging the power of CSS for styling, you can craft tables that are both beautiful and functional. Whether you’re building a simple product comparison chart, a complex financial report, or an interactive data dashboard, HTML tables provide a solid foundation for your web design endeavors.
As technology advances, so do the possibilities for creating dynamic and interactive tables. Explore JavaScript libraries like DataTables.js, Handsontable, and Tabulator to add sorting, filtering, pagination, and other features that enhance user engagement.
Remember, table design is an ongoing process of refinement and improvement. Experiment with different layouts, styles, and features to find what works best for your specific content and audience. Embrace the principles of accessibility and user experience to ensure that your tables are inclusive and easy to use for everyone.
And if you’re looking for a powerful and intuitive way to build stunning tables without the need for extensive coding, consider Elementor. Its drag-and-drop interface, pre-designed templates, and versatile styling options make it a valuable tool for web creators of all levels. With Elementor, you can unlock the full potential of HTML tables and elevate your website design to new heights.
Looking for fresh content?
By entering your email, you agree to receive Elementor emails, including marketing emails,
and agree to our Terms & Conditions and Privacy Policy.
