Key Takeaways
- Tracks crawl errors, indexing status, and technical site health straight from Google’s own database.
- Verifies website ownership through flexible methods like DNS records or a simple HTML tag.
- Monitors search queries, impressions, and click-through rates so you can improve content performance.
- Flags performance bottlenecks like Core Web Vitals so you can fix speed and user experience issues.
- Submits XML sitemaps to help search engines find and index your new pages faster.
Running a WordPress site can feel like steering a ship through a busy harbor. You’re focused on design and content, but how do you know search engines can read your pages? Google Search Console is your free window into how Google crawls and indexes your site, and it’s simpler than it looks.
What is Google Search Console and Why Does Your WordPress Site Need It?
Google Search Console (GSC) is a free Google service that helps you monitor, maintain, and troubleshoot how your site shows up in Google Search. It shows you exactly how Google sees your site, and for WordPress owners, it’s the most valuable source of first-party search data you’ll find.
Site owners often mix up Search Console with Google Analytics. Analytics tracks what visitors do once they land on your site. Search Console tracks how people find you, and how Google itself reads your code, including which keywords drive traffic.
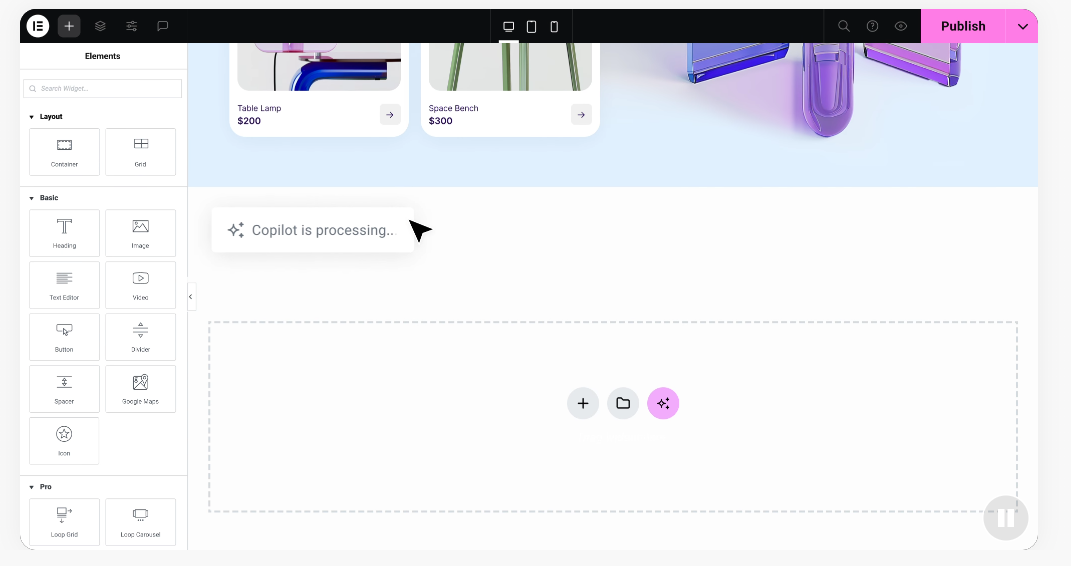
When you build a site, you want full control over layout and design. The Elementor website builder gives you plenty of visual freedom, but even a beautiful design needs solid technical representation in Google’s database, and Search Console confirms that search bots can read it correctly.
Setting Up and Verifying Your WordPress Site in GSC
Before Google shows you any private performance data, you need to prove you own the site. That’s called verification, and Google offers a few ways to do it.
You can set up your property as a Domain Property or a URL Prefix Property. A Domain Property covers every subdomain and both HTTP and HTTPS, but needs DNS verification. A URL Prefix Property only tracks one URL path and is simpler to set up.
Here’s how to verify your site with the URL Prefix method:
- Log into your Google account and go to the Search Console homepage.
- Select “Add Property” from the dropdown in the top-left corner.
- Enter your homepage URL into the “URL Prefix” box and click “Continue.”
- Copy the HTML meta tag from the verification options shown on screen.
- Paste that meta tag into your WordPress header using an SEO plugin or theme editor, then click “Verify.”
If you’d rather skip the code, most WordPress SEO plugins let you paste your verification code directly. Once verified, Google starts collecting data, though it can take up to 24 hours to populate your dashboards the first time.
Navigating the GSC Dashboard: The Core Performance Metrics Explained
The Search Results Performance report is the heart of Google Search Console. It shows which pages are popular, which need work, and what terms people use to find you.
The performance dashboard shows you:
- Calculates total impressions, or how many times your link showed up in search results.
- Counts actual clicks, the number of times people clicked through from Google Search to your site.
- Measures click-through rate (CTR), the percentage of impressions that turned into a click.
- Tracks average position, your page’s typical ranking spot for a given query.
Looking at these numbers together helps you spot easy wins. High impressions with a low CTR means you’re ranking well, but your title tag or meta description isn’t enticing clicks. A high CTR with a low position means searchers love the topic, so expanding that content could help.
Submitting and Managing XML Sitemaps in WordPress
An XML sitemap tells Google which pages are active, when they last changed, and how important they are. Instead of waiting for crawlers to find your pages, you can hand this map straight to Google.
WordPress generates a basic XML sitemap automatically, but most site owners prefer the more detailed sitemaps from dedicated SEO tools.
Follow these steps to submit your sitemap:
- Log in to your Search Console dashboard and click “Sitemaps” in the left navigation.
- Locate your XML sitemap URL in your WordPress SEO plugin (usually something like yoursite.com/sitemap_index.xml).
- Type the final part of that URL into the “Add a new sitemap” field.
- Click “Submit” to send your sitemap to Google’s indexing system.
After you submit, Google processes your sitemap and shows a status. A green “Success” means Google is using it. “Has errors” or “Couldn’t fetch” points to a formatting issue or a typo, so double-check the URL.
Identifying and Resolving Core Web Vitals and Page Experience Issues
Google favors sites that load fast and feel stable, and that focus on user experience gets measured through Core Web Vitals. Slow or jumpy pages can see rankings slip.
Core Web Vitals track three metrics: Largest Contentful Paint (LCP) for loading speed, Interaction to Next Paint (INP) for responsiveness, and Cumulative Layout Shift (CLS) for visual stability. Google measures these on real devices, flagging poor experiences in red.
Well-coded layouts help protect your Core Web Vitals. Elementor features like container optimization and lazy loading keep your DOM size small and your pages fast.
The Core Web Vitals dashboard helps you protect your site by doing the following:
- Pinpoints slow-loading media assets that delay your Largest Contentful Paint.
- Groups URLs with similar layouts so you can fix several issues at once.
- Isolates mobile styling bugs that trigger Cumulative Layout Shift warnings.
- Highlights performance differences between desktop and mobile visits.
- Charts historical trends so you can see whether your page speed is improving or worsening.
Troubleshooting Indexing and Crawling Errors
If Google can’t crawl your pages, they can’t rank. The “Pages” report shows which pages Google has visited and whether it added them to its index.
Don’t panic over “Not Indexed” pages. Many are normal, like feed URLs and pages you deliberately blocked with a “noindex” tag.
The “Pages” report helps you track down common technical blocks, including:
- Identifies soft 404 errors, where a page shows “not found” but tells the browser it loaded fine.
- Flags server errors (5xx) that suggest your hosting dropped connections during a Googlebot crawl.
- Detects redirect loops where your URLs point back and forth at each other endlessly.
- Uncovers “noindex” tags left active by accident after a move from staging to live.
- Spots crawl anomalies where Googlebot couldn’t reach your page due to a temporary server spike.
To diagnose one page, paste its URL into Search Console’s search bar. That opens the URL Inspection Tool, showing how Google sees the page and any indexing blocks. Just fixed an error? Click “Request Indexing” to ask Googlebot to look again.
Enhancing CTR with Rich Results and Schema Markup
Ever notice how some search results look more interesting than others? Star ratings, prices, or FAQ dropdowns can appear right under the main link. These are rich results, and they can lift your click-through rate.
Search Console doesn’t add schema markup for you, but it validates it. Under “Enhancements,” it detects any schema on your site and monitors its health.
Monitoring these reports helps keep your snippets displaying correctly:
- Validates that your structured data meets Google’s guidelines.
- Flags missing required fields like product prices, reviews, or availability.
- Warns you when optional, non-critical schema fields are missing.
- Tracks how many rich search impressions your snippets are earning over time.
- Confirms successful validation once you’ve patched your code.
A red error means your structured data is broken and Google will temporarily ignore it. Fix these quickly.
Security, Manual Actions, and Mobile Usability
Google takes user safety seriously. A hacked site, malware, or a violation of Google’s guidelines can drop your search presence overnight.
A “Manual Action” is a penalty applied by a human reviewer at Google, triggered by webspam, hidden text, or unnatural backlinks. Once you clean things up, you can submit a reconsideration request.
The Security Issues report works the same way, flagging malicious redirects or phishing scripts so you catch problems before lasting damage.
Search Console also tracks mobile usability. More than half of search traffic happens on mobile, so your mobile experience shapes rankings on both desktop and mobile.
The mobile usability dashboard helps you clean up mobile layouts by doing the following:
- Signals when your text is too small to read comfortably on a phone screen.
- Flags clickable links or buttons spaced too close together for fingers to tap.
- Identifies content blocks that overflow the edges of mobile viewports.
- Detects viewport configuration errors that stop pages from scaling correctly.
- Verifies that your design updates stay responsive across viewports.
A Comparison of Search Console Verification Methods
Choosing the right verification method matters more than you’d think. Delete a tracking tag by accident, and you could lose your historical data entirely.
| Verification Method | Technical Difficulty | Implementation Location | Recommended For | Accidental Deletion Risk |
|---|---|---|---|---|
| DNS TXT Record | Medium-High | Domain Registrar settings | Advanced site owners, multisite networks | Very Low (safest method) |
| HTML File Upload | Medium | WordPress Root Directory via FTP | Users with server file access | Low (unless site files are deleted) |
| HTML Meta Tag | Low | WordPress Theme Header File | Beginners using SEO plugins | Medium (can be lost during theme swaps) |
| Google Tag Manager | Low-Medium | GTM Container Snippet | Marketers managing tracking codes | Medium (if container is modified) |
For most site owners, DNS TXT record is the best long-term choice, since it lives at your registrar and won’t get overwritten when you change themes.
“Google Search Console isn’t just a diagnostic tool; it’s your website’s direct dialogue with Google. By checking your crawl statistics and index coverage weekly, you can catch indexing bottlenecks before they hurt your organic ranking. It’s the ultimate truth-teller for technical health.”
– Itamar Haim, Web Development Specialist
Step-by-Step Diagnostic Routine for Organic Growth
Now that your site’s verified and your sitemap’s submitted, it’s time for a regular diagnostic routine. You don’t need to check daily, but once a month catches issues before they hurt your traffic.
Here’s a simple monthly checklist to keep your WordPress SEO on track:
- Check the “Indexing” report to confirm your total indexed page count is stable. A sudden drop means crawl errors or accidental “noindex” tags, so look right away.
- Sort your Performance report by impressions to find high-interest search queries ranking in positions 8 through 15.
- Update those high-impression pages with deeper content, clearer titles, and stronger internal links to push them onto the first page of results.
- Review the “Core Web Vitals” dashboard for both mobile and desktop to confirm your layouts load fast and stay stable for visitors.
- Inspect your “Security & Manual Actions” reports to confirm a clean bill of health with Google’s webspam team.
This routine keeps you in tune with how Google interacts with your WordPress setup, and it takes the guesswork out of SEO.
Integrating GSC with Other Technical Tools
Search Console gets even more valuable once you connect it with other marketing tools. Link it with Google Analytics 4 (GA4) and you can view your search query data right inside your traffic reports.
If you prefer a visual workflow, some connections let you view performance metrics inside your design workspace. Compare that to hosted builders like Wix, Squarespace, or Webflow, or WordPress options like Divi or Beaver Builder, and WordPress generally gives you the deepest control over fixing issues Search Console surfaces.
Matching your site setup to your growth targets matters when building high-performance pages. The right Elementor plan gives you tools to resolve issues Search Console finds. The Elementor SEO resources are a good place to start.
Integrating your technical search analytics tools lets you do the following:
- Combines search intent queries with post-click behavior in Google Analytics 4.
- Pulls search performance metrics into visual business reports and custom dashboards.
- Merges search positioning data with local search tracking platforms.
- Exports clean crawl error lists to spreadsheets for your web development team.
- Connects keyword discovery data with your product strategy to find new business opportunities.
Frequently Asked Questions
Why is Google Search Console showing different traffic numbers than Google Analytics?
Search Console tracks search clicks from Google Search results specifically. Analytics tracks total visits from every source, including direct traffic, social media, and other search engines like Bing or Yahoo. It can record a click even if a visitor closes their browser before Analytics loads.
How long does it take for Google Search Console to show search data?
Once you verify ownership, it typically takes 24 to 48 hours for Search Console to populate your dashboards. After that, data updates continuously with a lag of about 12 to 36 hours, and you can view historical data going back up to 16 months.
What should I do if my sitemap shows a “Couldn’t fetch” status?
Don’t worry about a “Couldn’t fetch” error. It’s often a temporary glitch from a minor network delay. Check the sitemap URL in an incognito window; if it loads fine, wait a few days and Google will usually fetch it. If the error persists, check your robots.txt file for blocked crawlers.
Can I use Google Search Console for a free WordPress.com site?
Yes, but access depends on your plan level. You need a tier that lets you add custom meta tags or use DNS records. Self-hosted WordPress sites don’t have these restrictions.
What is the difference between a Domain property and a URL Prefix property?
A Domain property covers your entire domain, including all subdomains, both protocols, and subfolders, verified through your DNS registrar. A URL Prefix property only tracks one path and is easier to verify with HTML tags, but won’t capture traffic to other domain variations.
How do I fix “Discovered – currently not indexed” in GSC?
This means Google knows your page exists but hasn’t crawled or indexed it yet, often a crawl budget issue on larger sites. Improve your internal linking so Googlebot can find new pages, and keep content high-quality and genuinely helpful.
How often does Google Search Console update its performance metrics?
The main Performance report updates several times a day, with a “Last updated” timestamp showing how fresh the data is. Technical reports like Indexing and Core Web Vitals update less often, sometimes taking a week or more after you fix an error.
What is a manual action and how do I remove it?
A manual action is a penalty a human reviewer applies because your site violated webmaster quality guidelines, due to webspam, thin content, or manipulative backlinks. To remove it, resolve the issues fully and submit a “Reconsideration Request” explaining the steps you took.