Understanding bandwidth alert discrepancies
It can be confusing to receive an automated email stating you have reached 100% of your bandwidth limit while your My Elementor dashboard shows a different figure, such as 76%. This discrepancy is common and is typically due to how the system processes and displays real-time data.
Why the Numbers Don’t Match
The primary reason for the difference between your email alert and the dashboard is the data synchronization delay.
- Real-Time Alerts: Our monitoring system triggers email notifications the moment your site hits specific usage milestones (like 80%, 90%, or 100%) to give you immediate notice.
- The 24-Hour Sync: While the background monitor is constant, the My Elementor dashboard is not a real-time feed. It can take up to 24 hours for the statistics in your dashboard to update and reflect recent traffic spikes or storage changes.
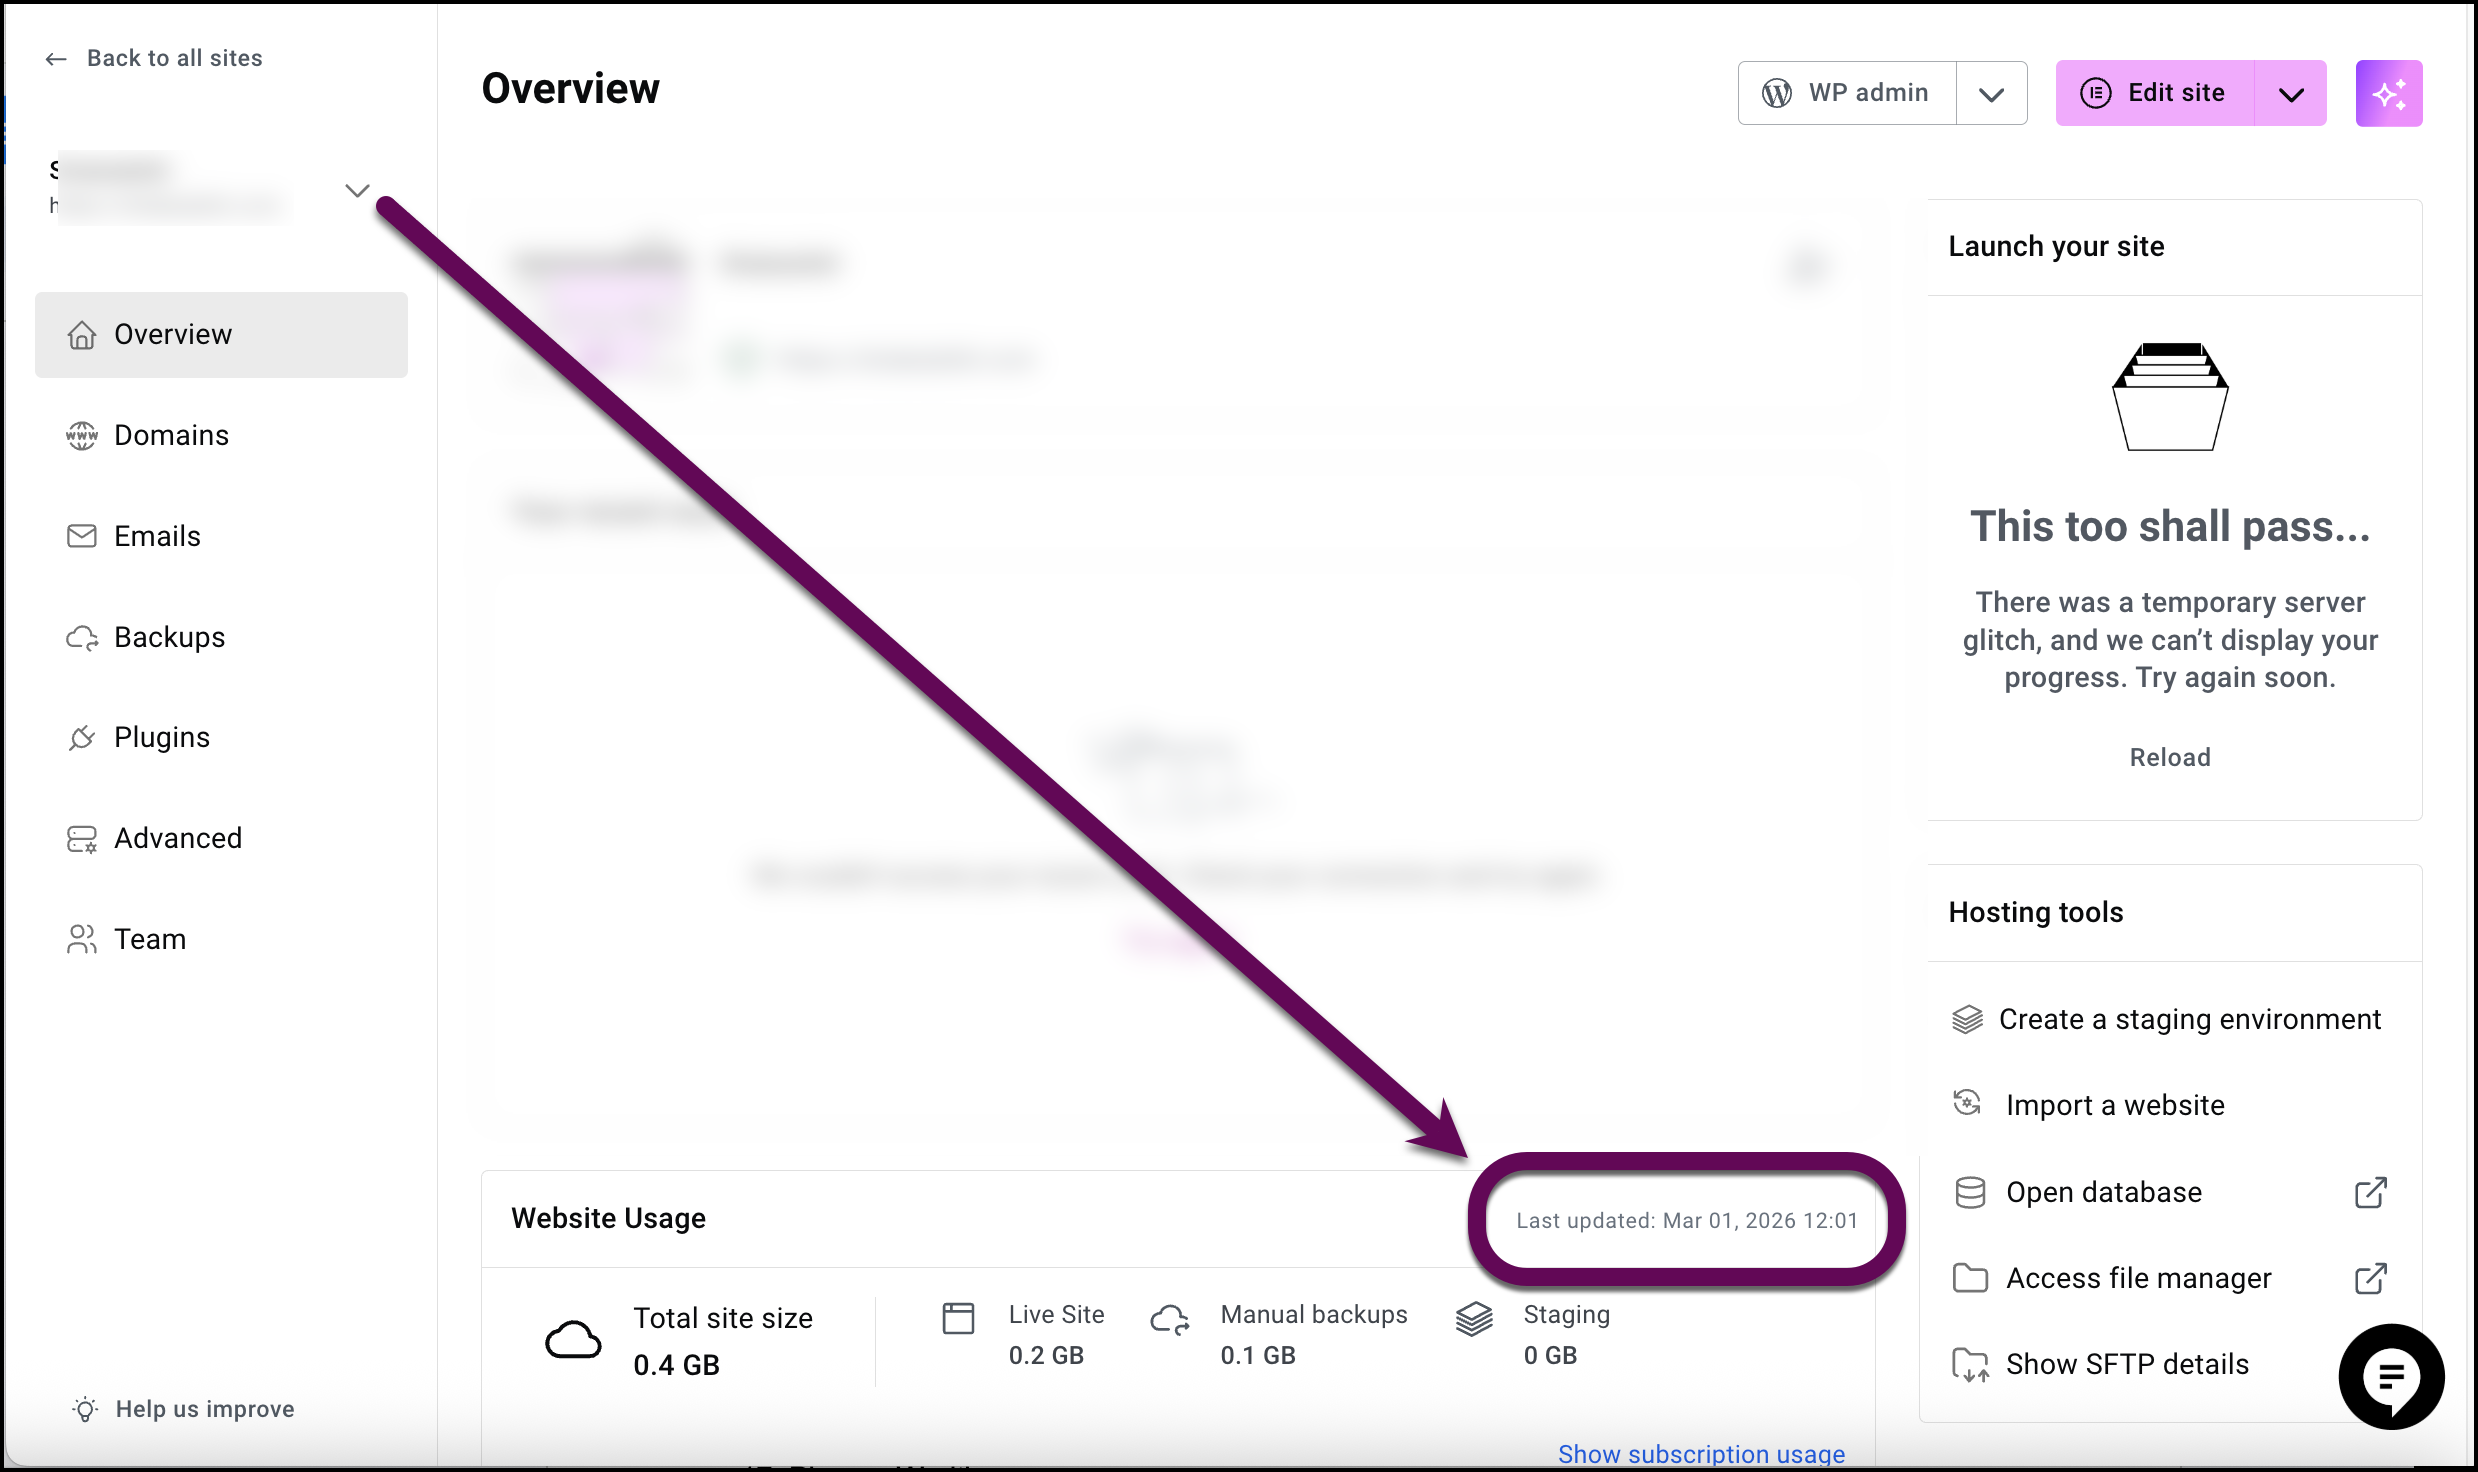
- Last Updated Timestamp: You can verify exactly when your data was last synced by checking the “Last updated” date and time displayed in the Website Usage section of your dashboard.
How to Verify Your Current Usage
To get the most current view of your site’s resource consumption:
- Access Statistics: For details, see Access your storage and bandwidth usage.
Managing Your Limits
If you find that your site is consistently nearing its limits, there are several ways to manage your resources:
- Upgrade Your Plan: If your traffic has permanently increased, upgrading your subscription is the most reliable way to avoid service interruptions.
- Optimize Performance: Use tools like Object Caching to reduce the load on your server and improve page delivery speed. For details, see Object caching.
- Clear Storage: If storage is also an issue, consider deleting old media files or unneeded manual backups. Note that automatic backups do not count against your storage limit.
Important
If you take action to reduce your bandwidth or clear storage today, remember that it will still take up to 24 hours for those changes to be visible in your dashboard stats.