You can monitor your site’s performance, SEO, and accessibility scores through the Manage dashboard. By selecting a site within the Managed Sites view and clicking the Monitoring tab, you access real-time statistics and historical data for both mobile and desktop versions to help optimize your website’s user experience.
How do I navigate to the performance monitoring dashboard?
To view the performance metrics for your managed websites, follow these navigational steps within your account:
- Go to your My Elementor dashboard.
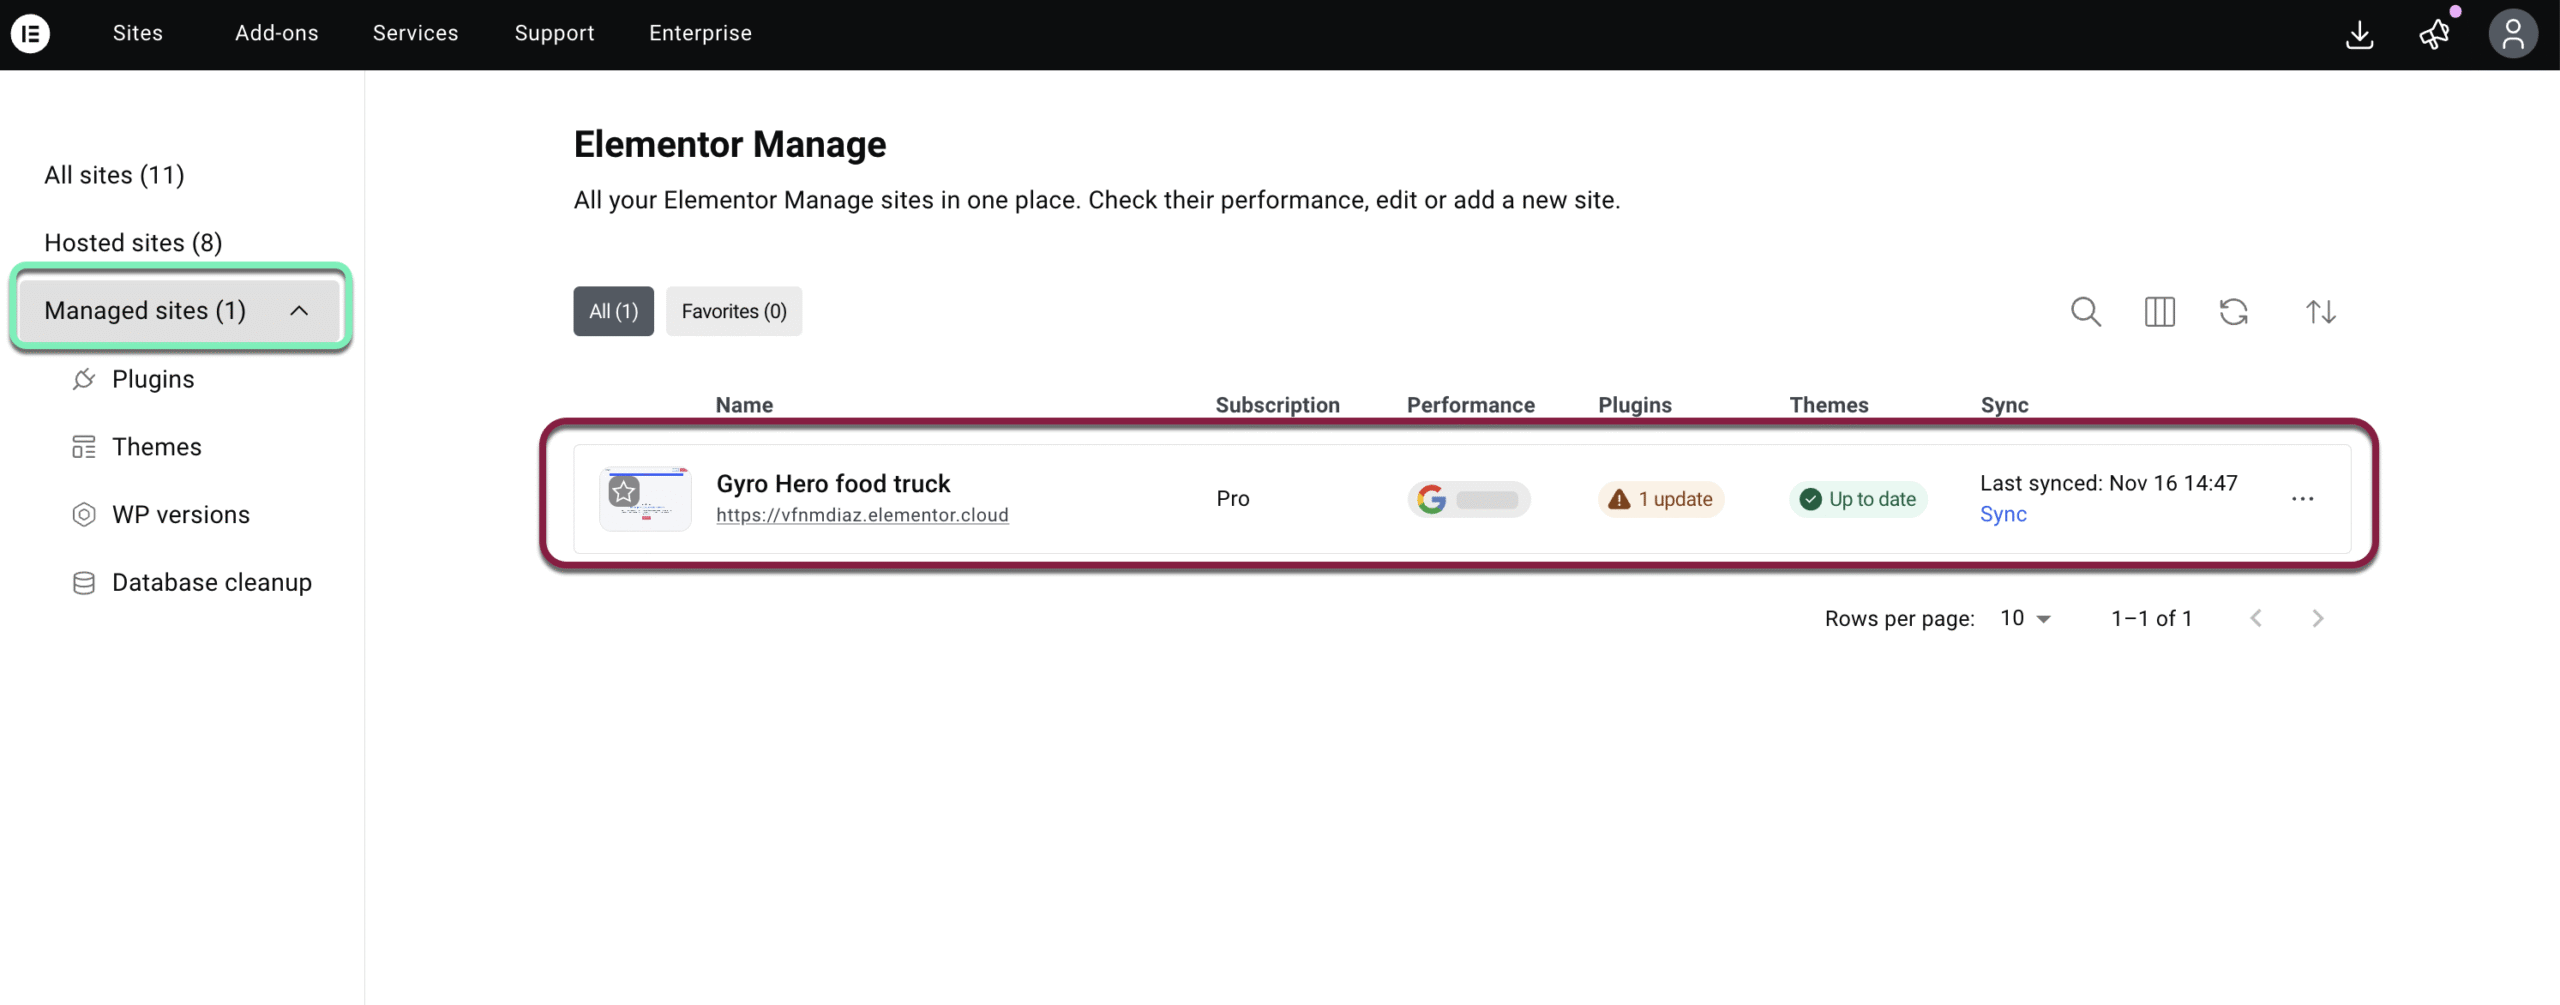
- Under the Sites tab in the top bar, go to Managed Sites.
- Click on the relevant site to go into the Managed site view.
- In the left-hand menu, click Monitoring.
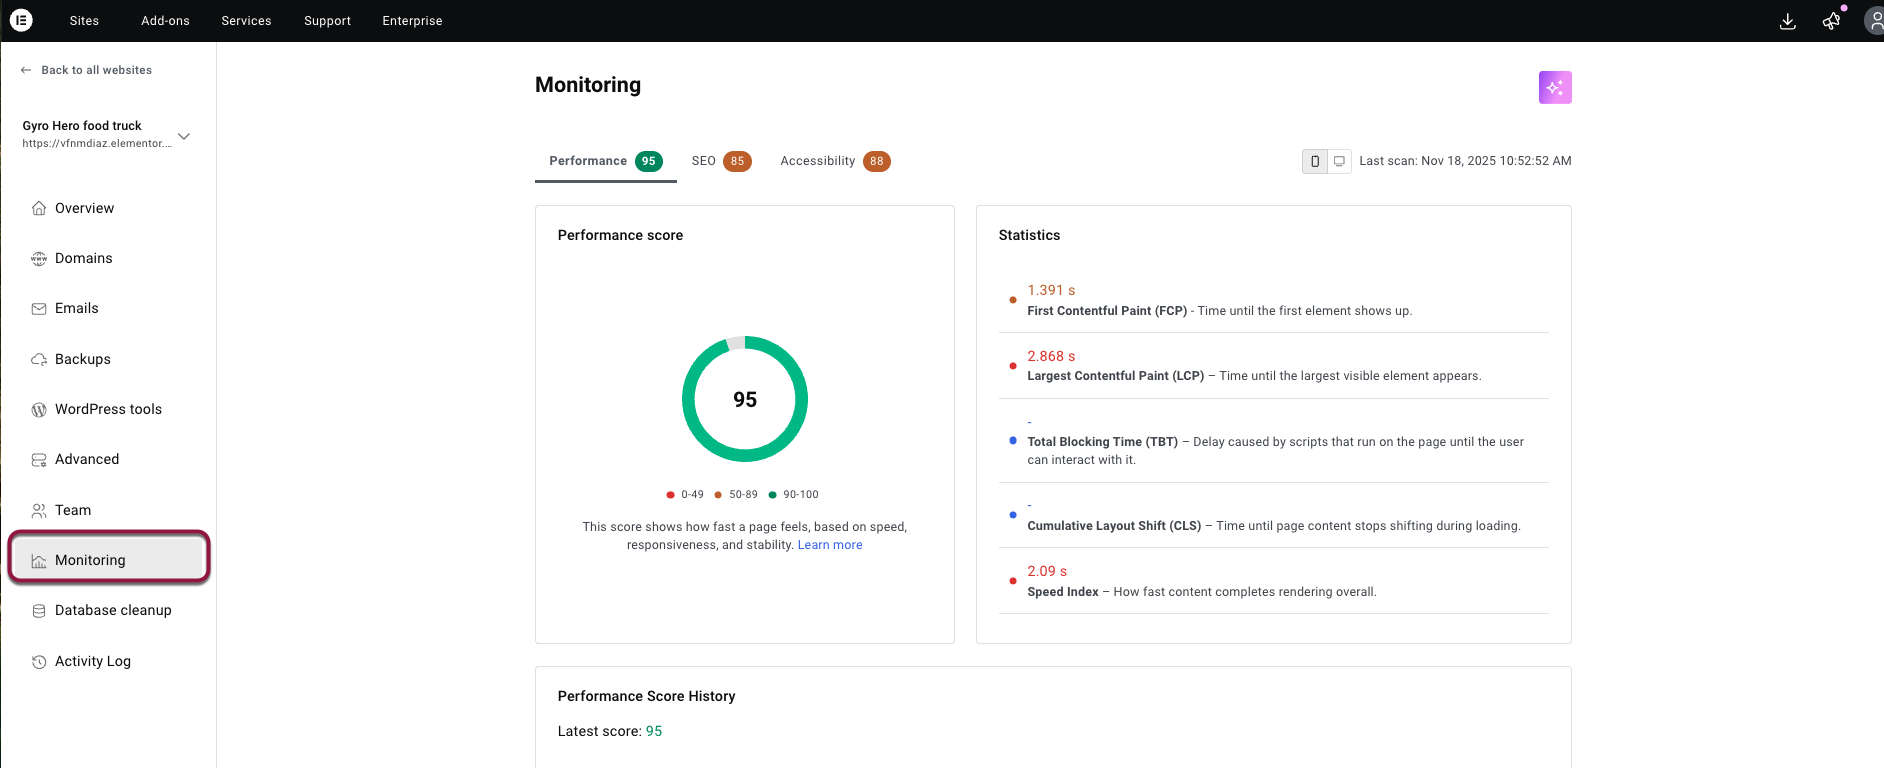
- In the Monitoring page, you’ll see:
- Performance score
- SEO score
- Accessibility score
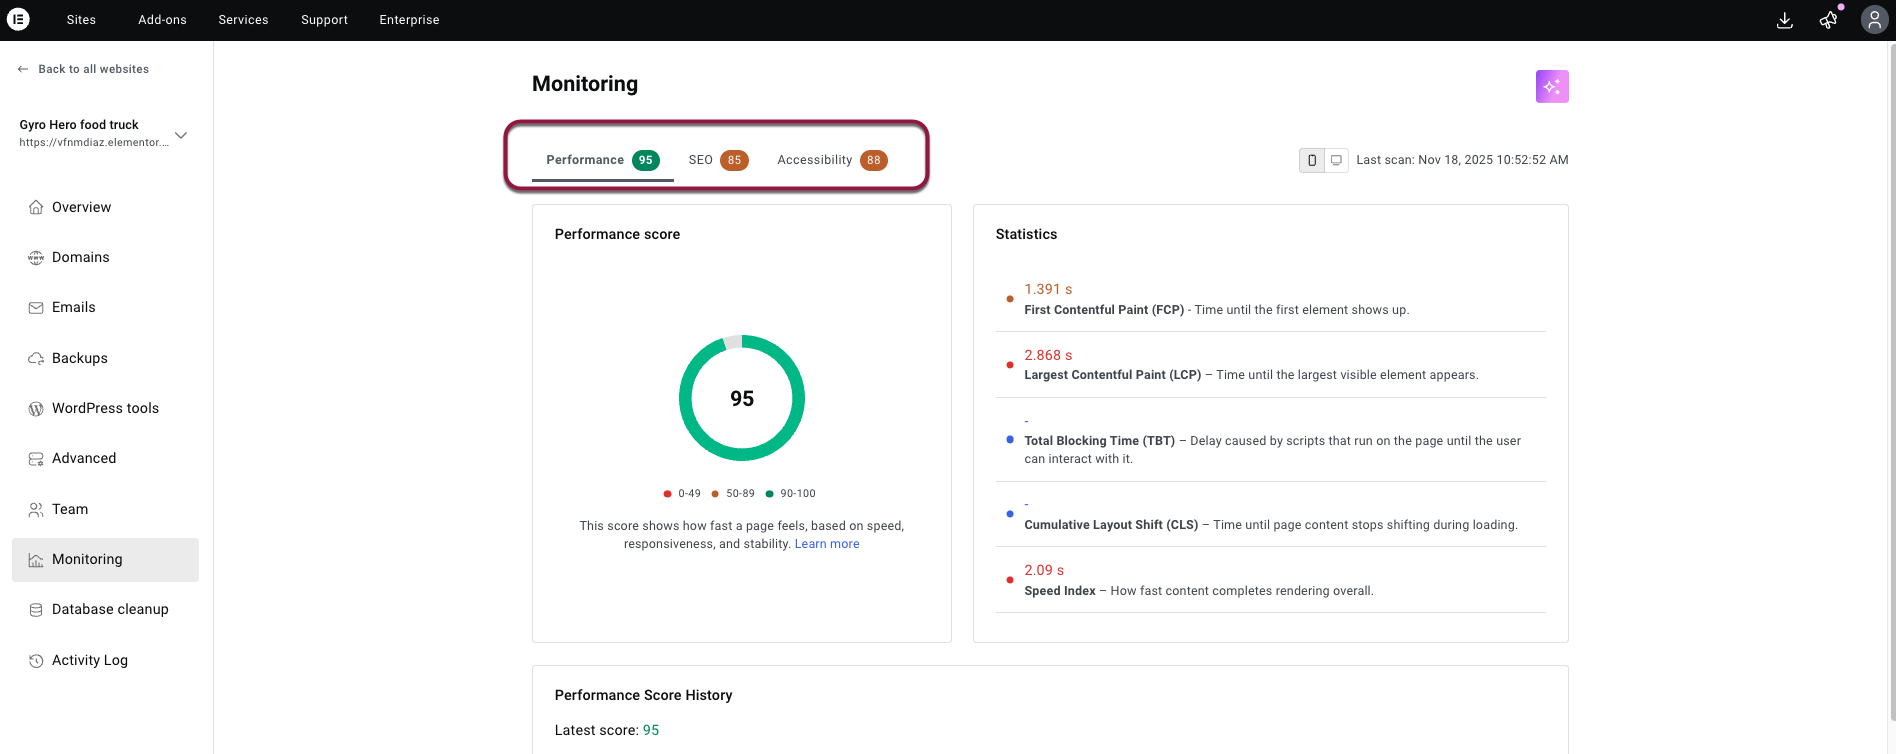
To view all the scores in detail, click through each column.
What specific scores can I track in Manage?
The monitoring interface provides high-level scores for three critical areas of website health:
Accessibility Score: Analyzes how easily users with disabilities can navigate and interact with your site.
Performance Score: Measures speed, responsiveness, and visual stability.
SEO Score: Evaluates how well the page adheres to search engine optimization best practices.
How do I interpret the colored score indicators?
Each score is color-coded to provide a quick visual assessment of your site’s status:
- 🟢 Green (90–100): Good
- 🟠 Orange (50–89): Needs improvement
- 🔴 Red (0–49): Poor
What technical metrics determine the performance score?
The Statistics section breaks down your performance score into five core technical parameters:
- First Contentful Paint (FCP): The time it takes for the first text or image element to appear.
- Largest Contentful Paint (LCP): The time required for the largest visible element to render.
- Total Blocking Time (TBT): The total delay caused by scripts that prevent user interaction.
- Cumulative Layout Shift (CLS): A measure of how much page content shifts during loading.
- Speed Index: An overall measure of how quickly content is visually displayed.
The frequency of scans depends on which plan you have.
How can I optimize low SEO and accessibility scores?
If your scores are in the orange or red categories, you can use the following tools to improve them:
- Passed Audits: Review items that are already successful to ensure they stay that way.
- Audits to Review: Click Show to see specific technical failures that need fixing.
- Image Optimizer: Use this tool to improve low FCP or LCP scores by reducing asset sizes.
- Ally Accessibility Plugin: Install this recommended plugin to identify and resolve complex accessibility barriers.
To learn more, see this documentation: About Pagespeed Insights